- The S&P500 is retracing down after holding near the all-time time.
- The market can continue to drop towards 2,880.00 and 2,960.00 support.
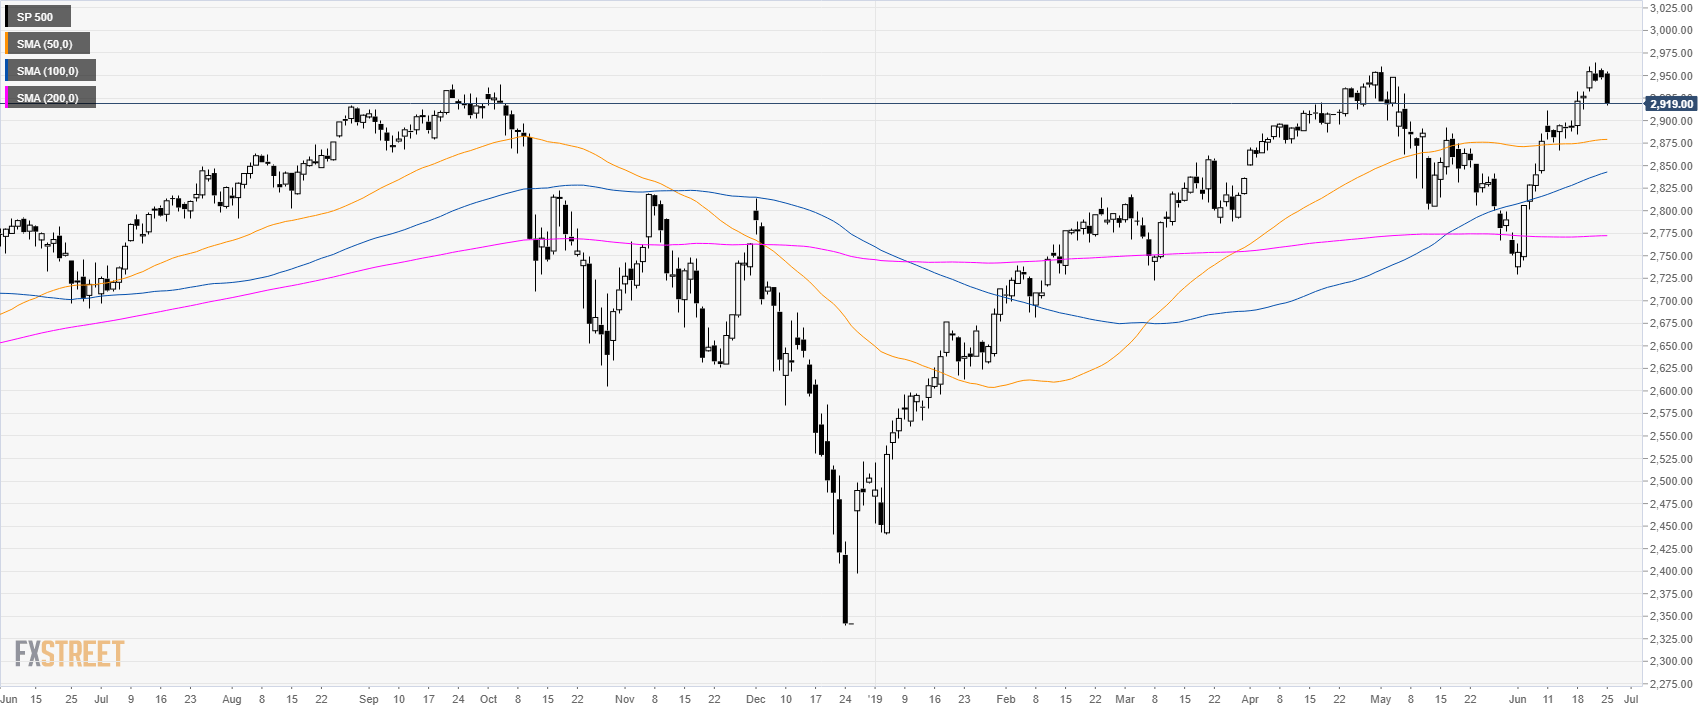
S&P500 daily chart
The S&P500 found resistance below 2,965.00 all-time high. The market erased the profits of the last three trading sessions.
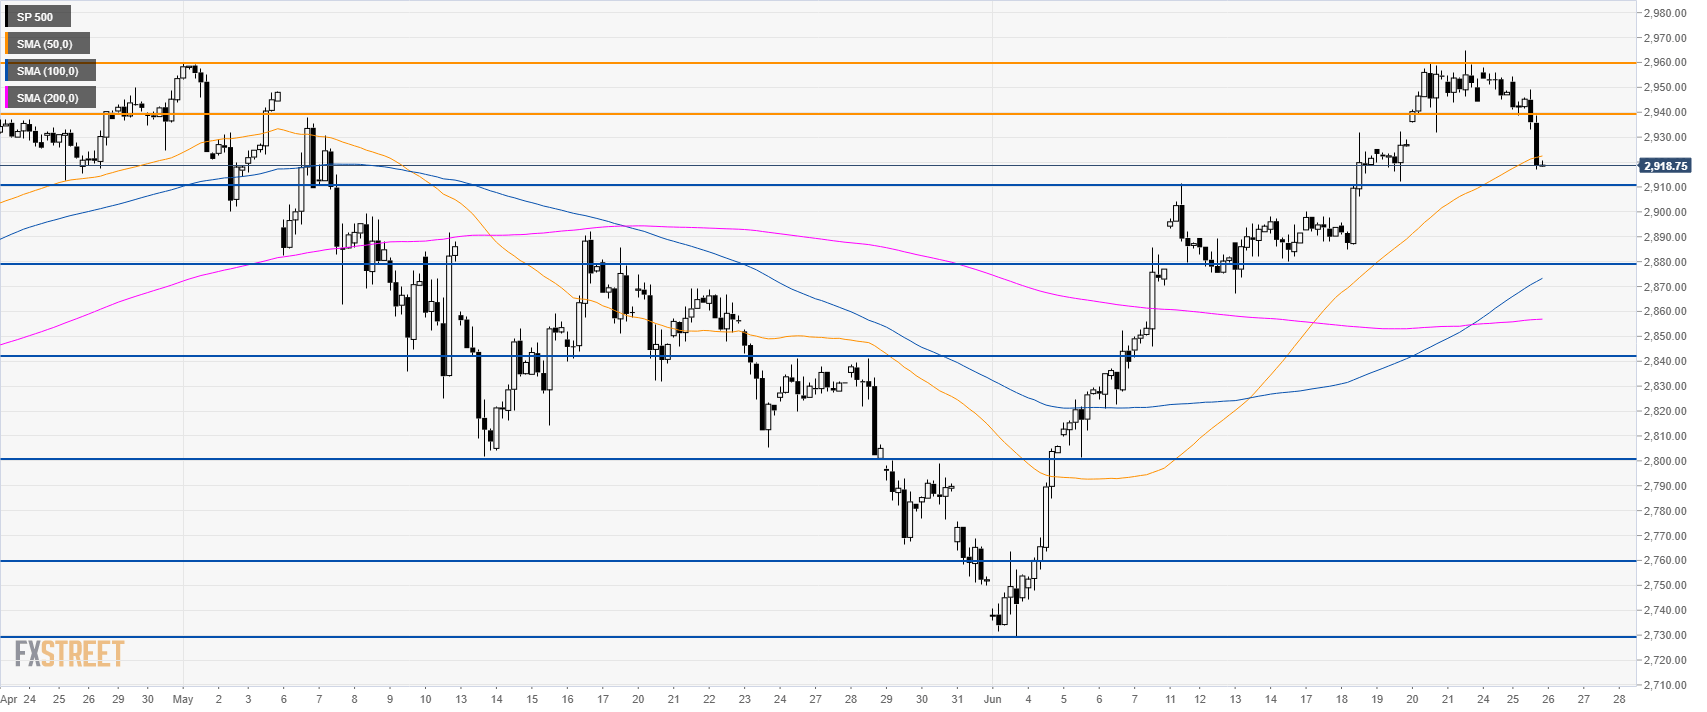
S&P500 4-hour chart
The stock index is about to test 2,910.00 support. The market is trading below the 50 simple moving average (SMA) suggesting a potential pullback down in the medium term. The next support is seen at 2,880.00 and 2,840.00. Resistance is at the 2,940.00 and 2,960.00 levels.
Additional key levels
