- A confluence region of short-term key EMAs limits the immediate upside of GBP/JPY.
- The area including June 19 and 25 low seems tough support to the south.
Failure to clear near-term key exponential moving averages (EMA) portrays the GBP/JPY pair’s weakness as it trades around 136.56 amid initial Asian session on Friday.
With this, 136.38 and 136.00 are likely immediate supports that can gain sellers’ attention whereas horizontal-region comprising lows of June 19 and 25 between 135.80/78 may please them afterward.
In a case where prices keep trading down past-135.78, month’s bottom of 135.37 and 135.00 round-figure can mark their presence on the chart.
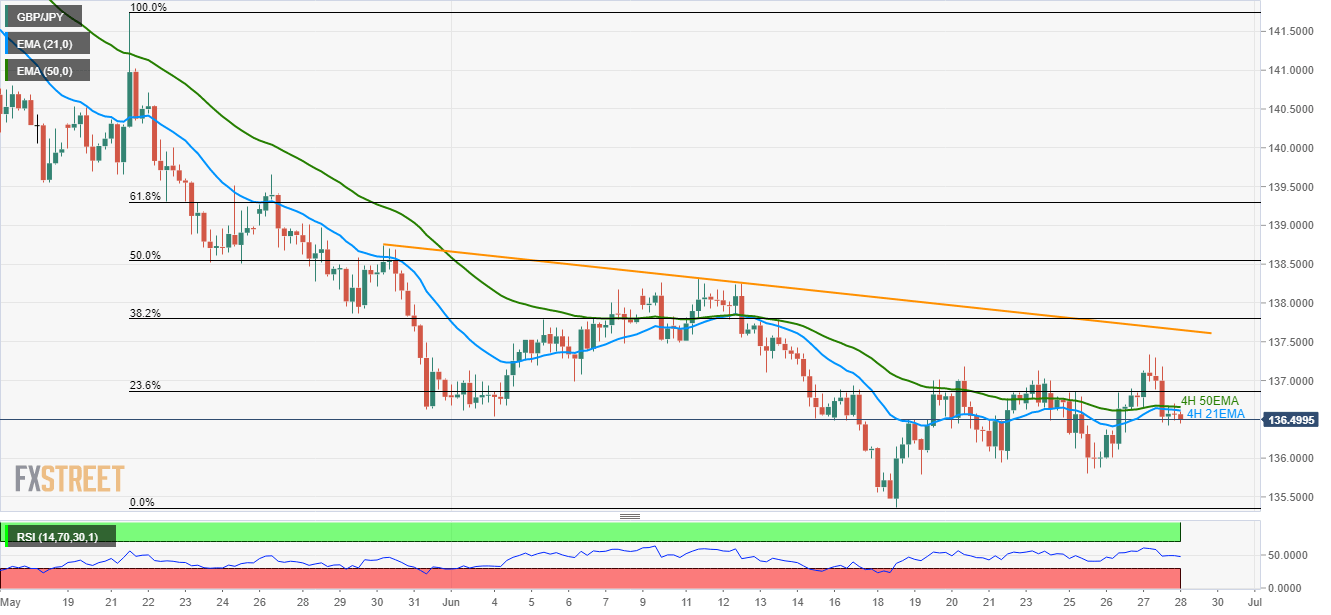
On the contrary, the successful break of 136.62/66 confluence of EMAs on 4-hour chart, namely the 4H 21 and 4H 50EMA, can trigger the pair’s recovery to 23.6% Fibonacci retracement of late-May to June declines, 136.86, while the week’s high of 137.34 might become buyers’ choice then after.
Though 4-week old descending trend-line at 137.65 could restrict the pair’s advances beyond 137.34, if not then June 11 high near 138.33 should appear on Bulls’ radar.
GBP/JPY 4-Hour chart
Trend: Bearish
