- 200-DMA and multiple lows from mid-February to mid-April limit the NZD/USD upside.
- Overbought RSI level is also exerting downside pressure on the prices.
With the medium-term key upside barrier playing its role to restrict the NZD/USD pair’s advances, the Kiwi trades near 0.6700 while heading into the European open on Friday.
Given the pair’s failure to cross the confluence area between 200-day simple moving average (200-DMA) and lows from mid-February to mid-April, coupled with overbought levels of 14-day relative strength index (RSI), chances of its dip to 0.6682/80 region comprising early month high become brighter.
However, pair’s declines below 0.6680 might have to clear 61.8% Fibonacci retracement of October – December upside, at 0.6633.
Meanwhile, a successful break above 0.6720 can quickly propel the pair to April 15 high near 0.6784 whereas 0.6800 round-figure and 23.6% Fibonacci retracement level near 0.6841 can please buyers afterward.
NZD/USD daily chart
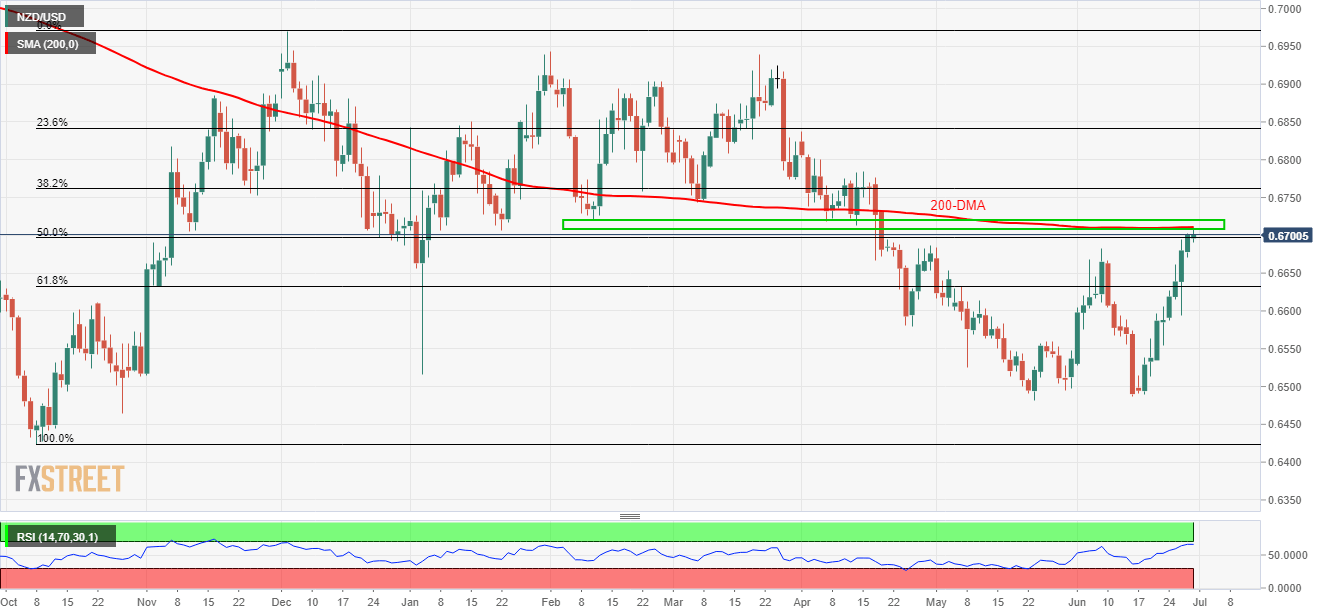
Trend: Pullback expected
