- GBP/USD is at its highest in 3 days.
- Bulls want to reach 1.2752 but can they overcome 1.2730 resistance?
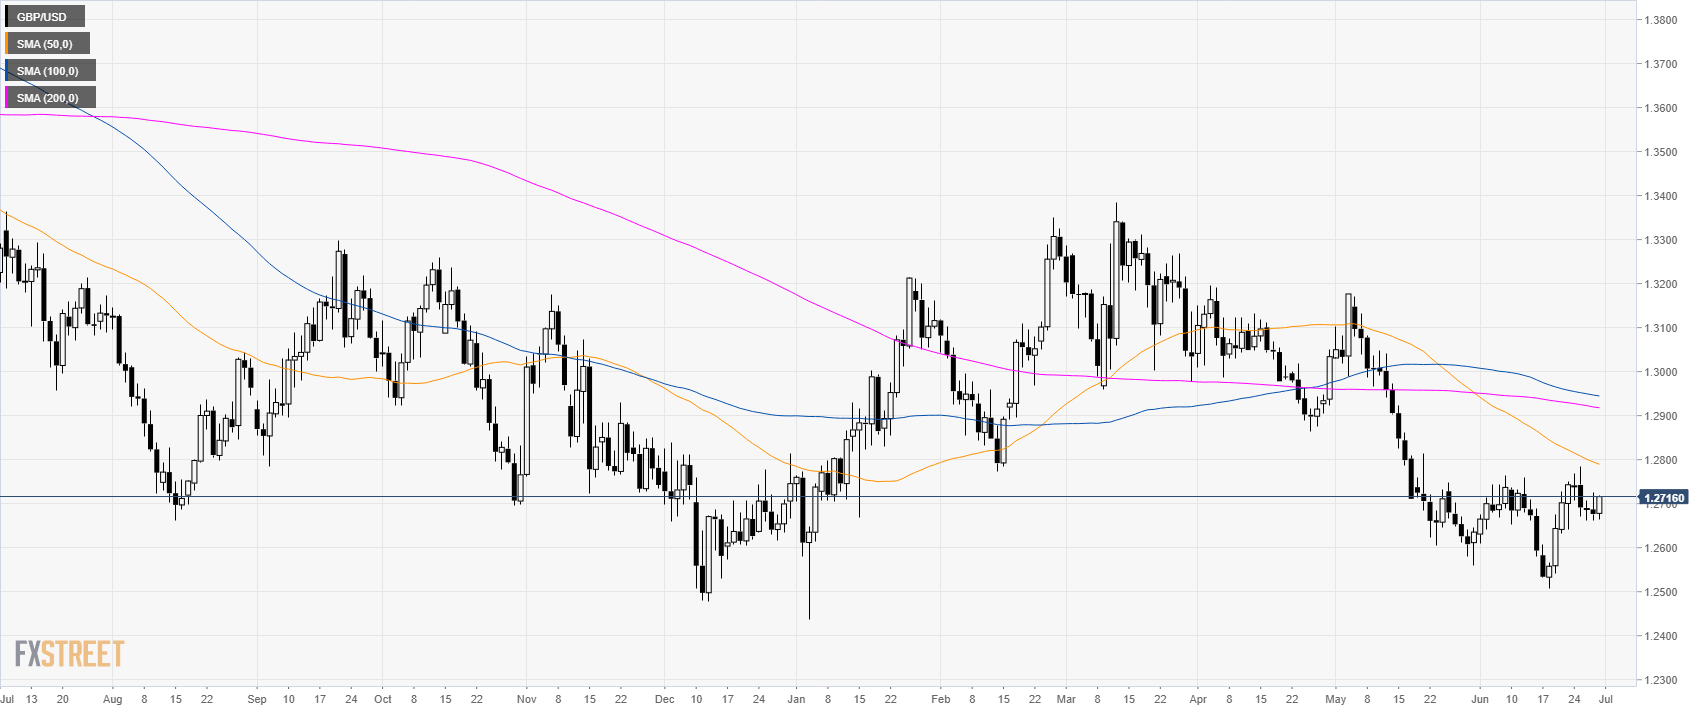
GBP/USD daily chart
GBP/USD is trading in a bear trend below the main daily simple moving averages (DSMAs). The market is trading back above the 1.2700 figure challenging Thursday’s high.
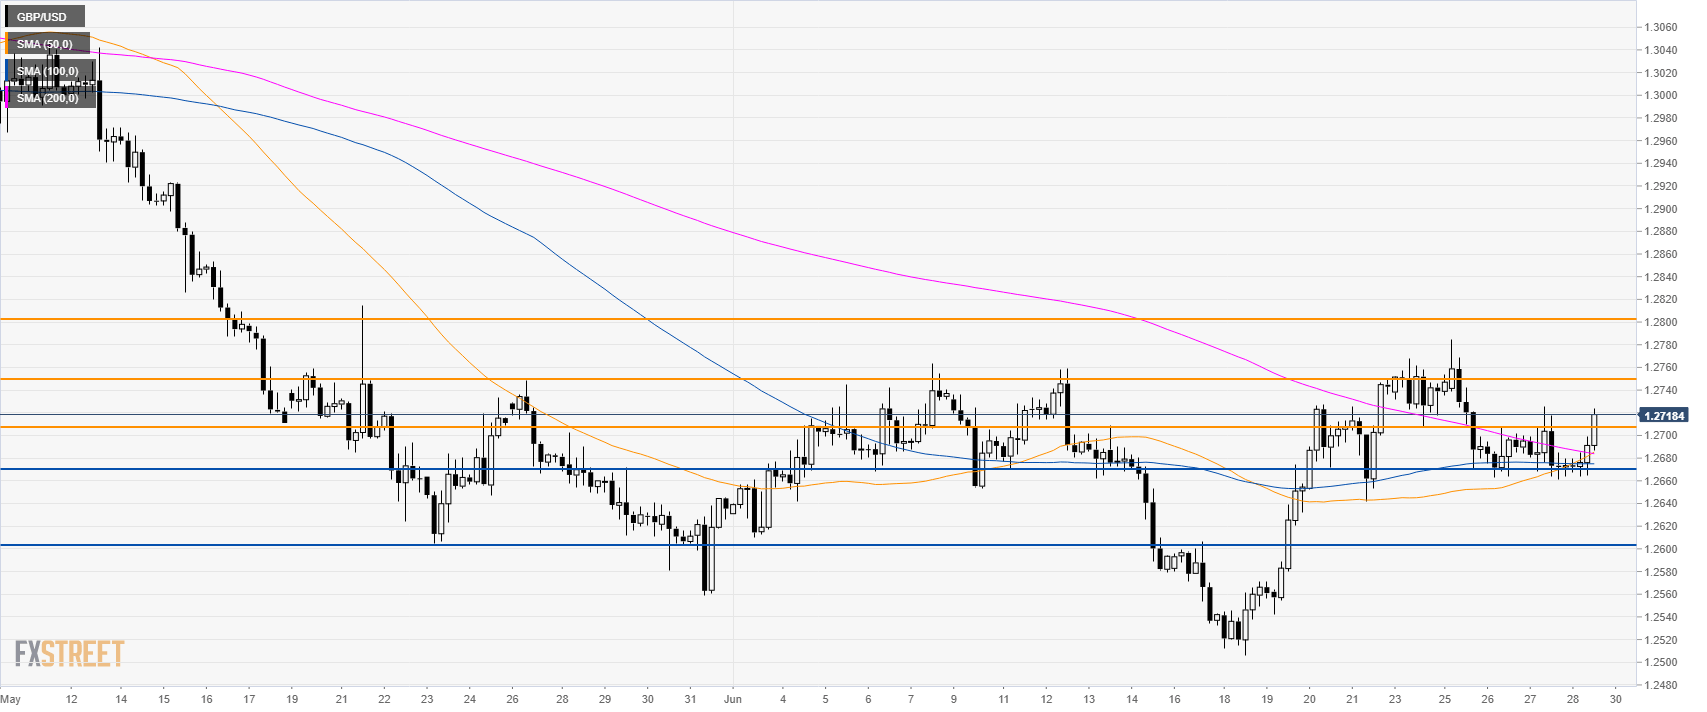
GBP/USD 4-hour chart
Cable is trading above its main SMAs suggesting potential strength in the medium term. Bulls want to reach 1.2752 and 1.2800 figure to the upside.
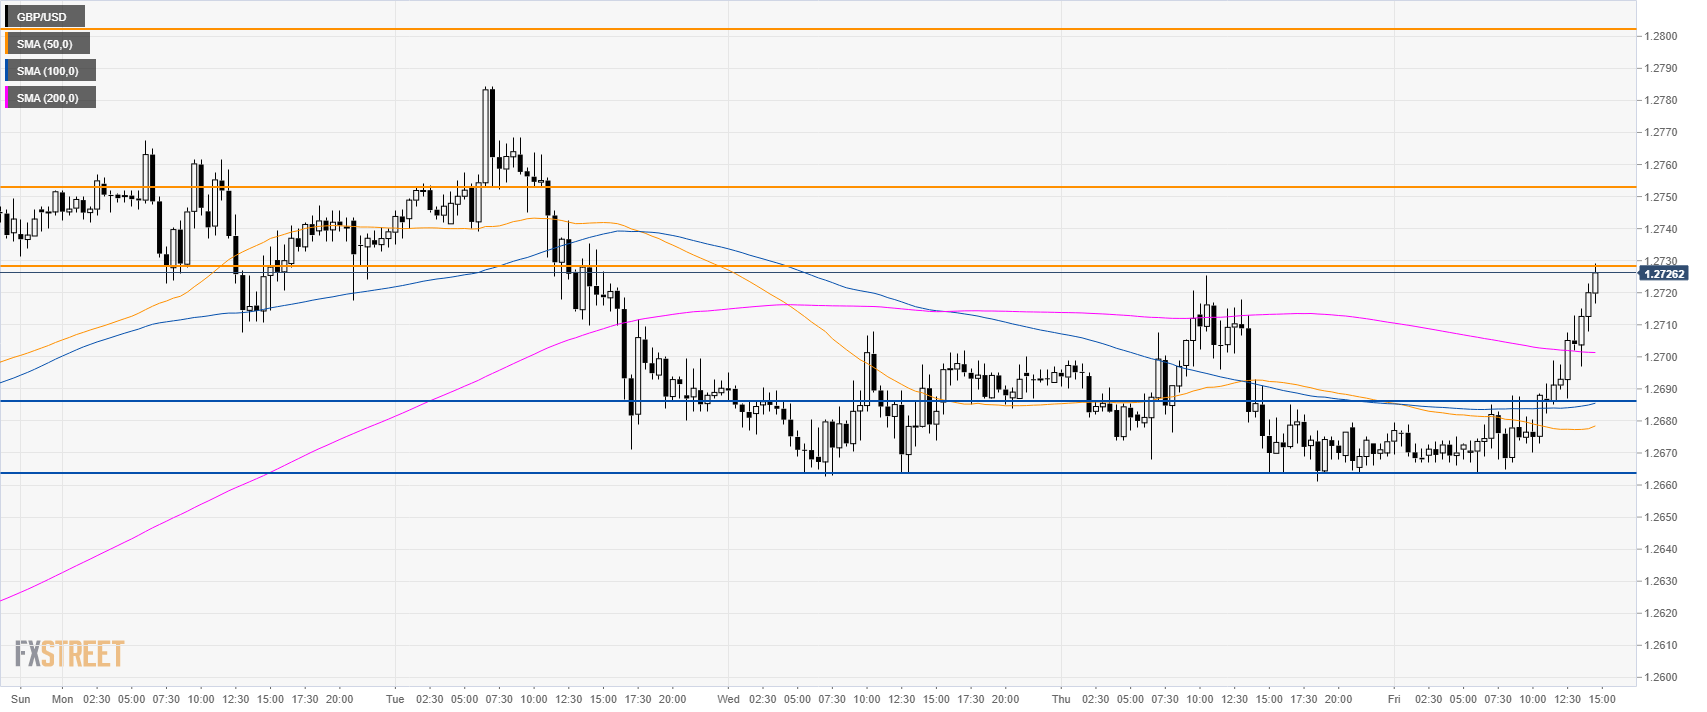
GBP/USD 30-minute chart
Bulls are testing 1.2730 near Thursday’s high. Will they be able to overcome this resistance? On the way down support is at 1.2686 and 1.2665, according to the Technical Confluences Indicator.
Additional key levels
