- GBP/USD is back near the 1.2700 figure.
- The market rejected 1.2730 resistance as the market reached 3-day high.
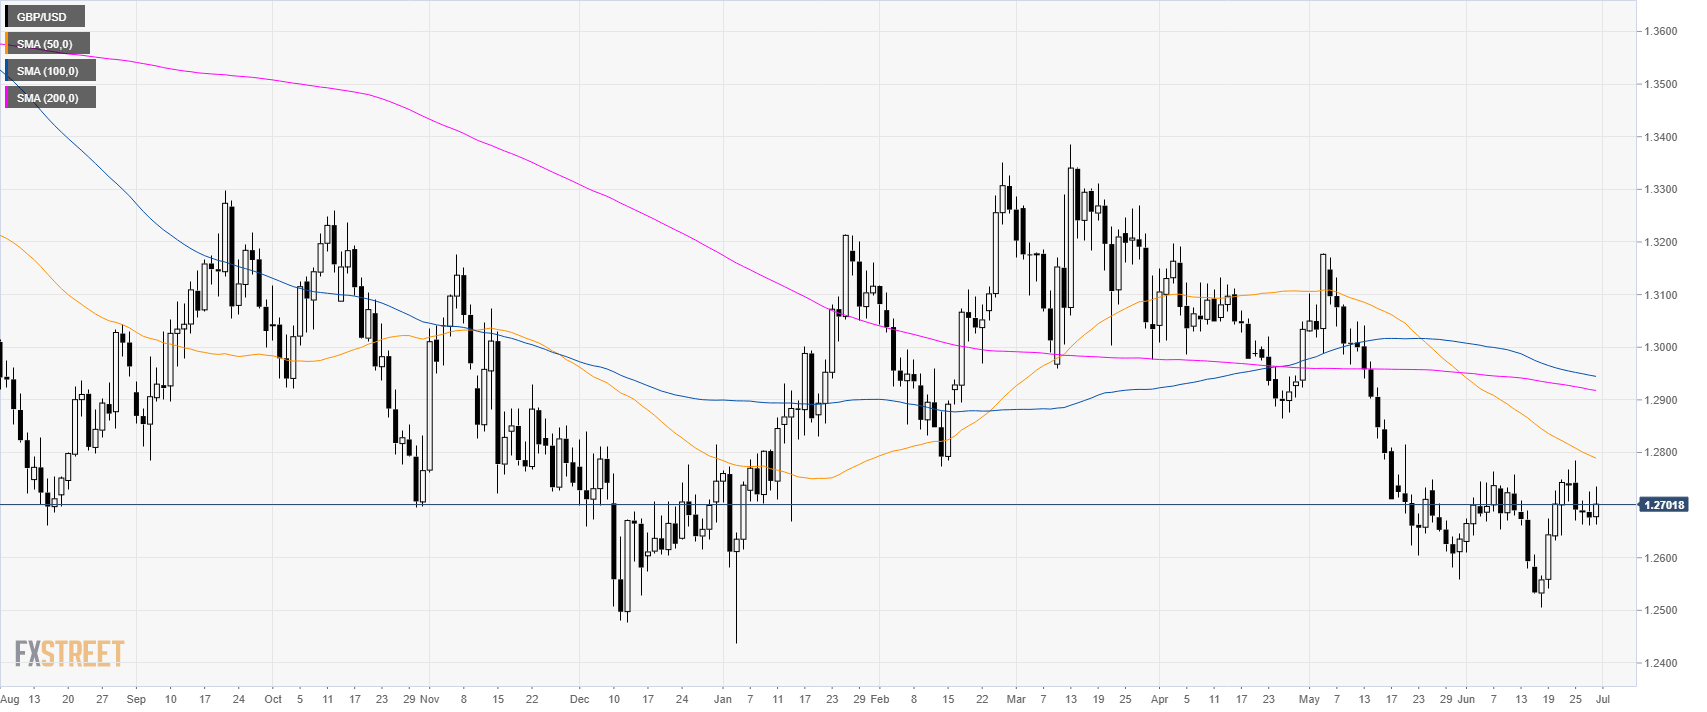
GBP/USD daily chart
GBP/USD is in a bear trend below its main daily simple moving averages (DSMAs). The market is back near the 1.2700 figure.
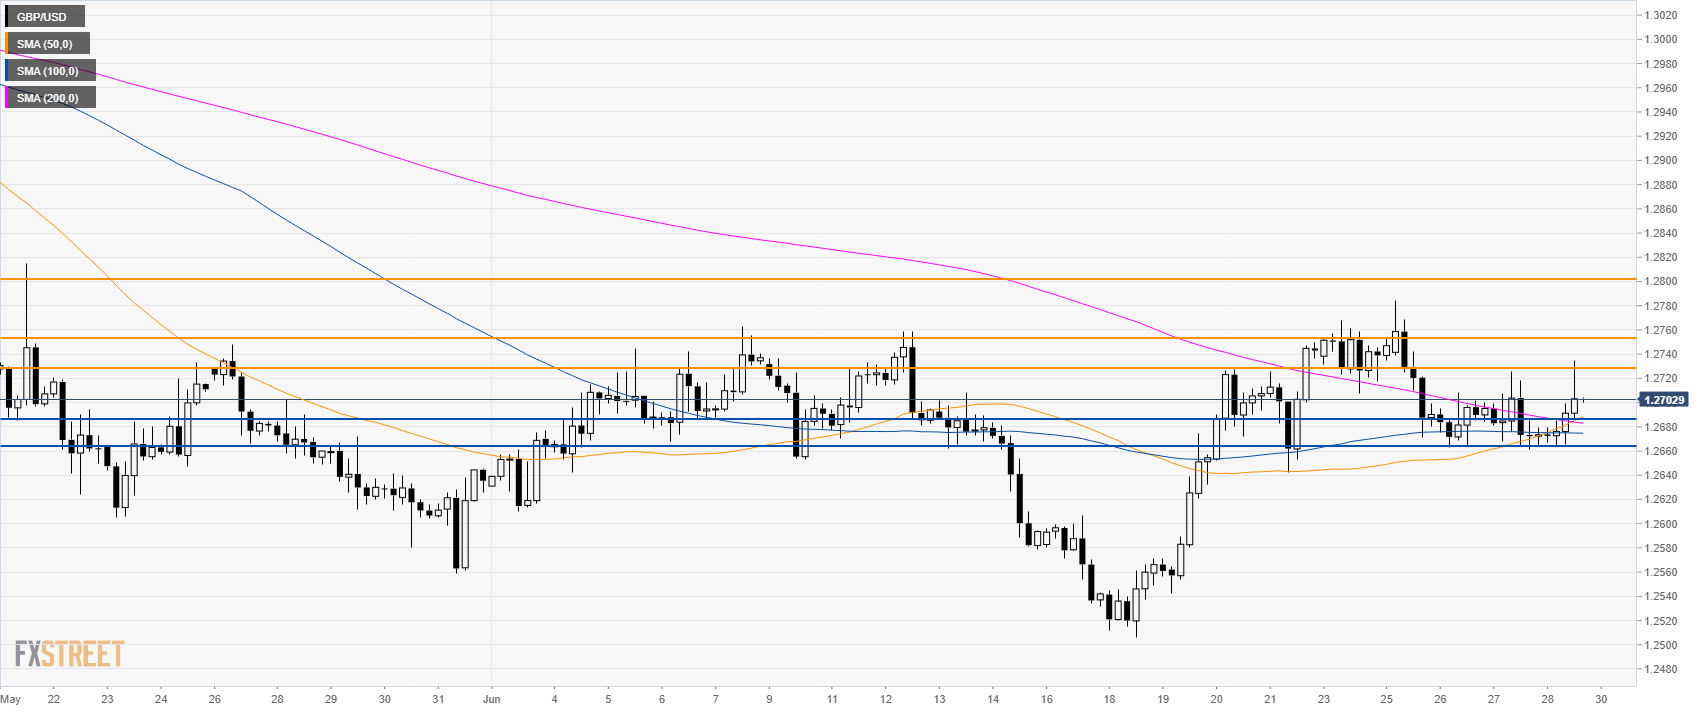
GBP/USD 4-hour chart
Cable is trading above its main SMAs suggesting potential bullish momentum in the medium term. Bulls want to reach 1.2752 and 1.2800 resistances to the upside.

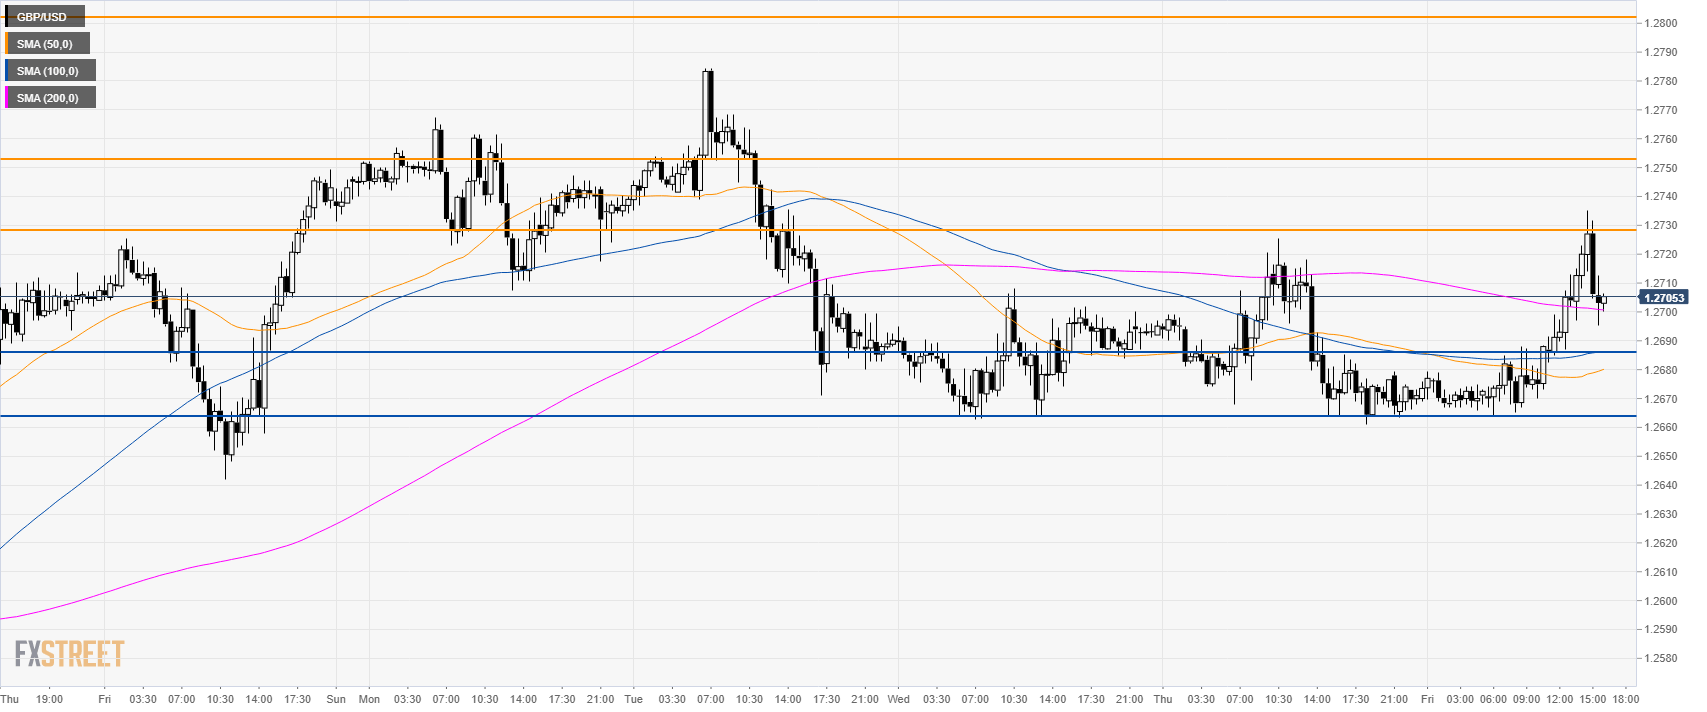
GBP/USD 30-minute chart
The market found resistance at 1.2730. Looking down support is at 1.2686 and 1.2665, according to the Technical Confluences Indicator.
Additional key levels