- Overbought RSI limits the USD/JPY pair’s upside momentum despite clearing 2-month old resistance-line.
- 4H 200MA can also challenge buyers during fresh advances.
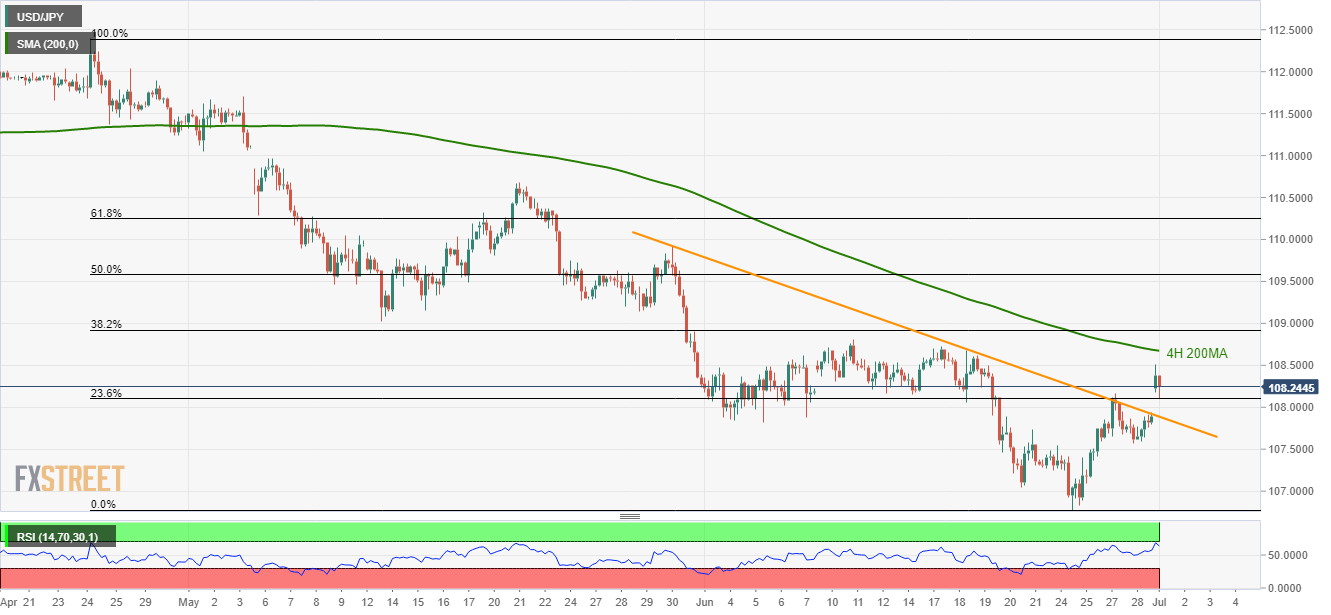
Overbought levels of 14-bar relative strength index (RSI) drags the USD/JPY pair back to 23.6% Fibonacci retracement of April – June declines as it trades near 108.24 during early Monday.
While 23.6% Fibonacci retracement level of 108.10 acts as immediate support, a five-week-old resistance-turned-support-line at 107.90 may question the pair’s additional weakness.
Should there be extended downpour below 107.90, 107.40 and 107.00 may come back on the chart.
Meanwhile, pair’s rise beyond the latest high of 108.51 highlights the importance of 200-bar moving average on the 4-hour chart (4H 200MA), at 108.67 now.
Given the buyers’ ability to cross near-term key MA level, May 13 low near 109.00 grabs the spotlight.
USD/JPY 4-hour chart
Trend: Pullback expected
