- 9-week old horizontal support can please sellers should NZD/USD closes below 50% Fibonacci retracement.
- An upside clearance of 200-D EMA highlights 0.6764 as the key resistance.
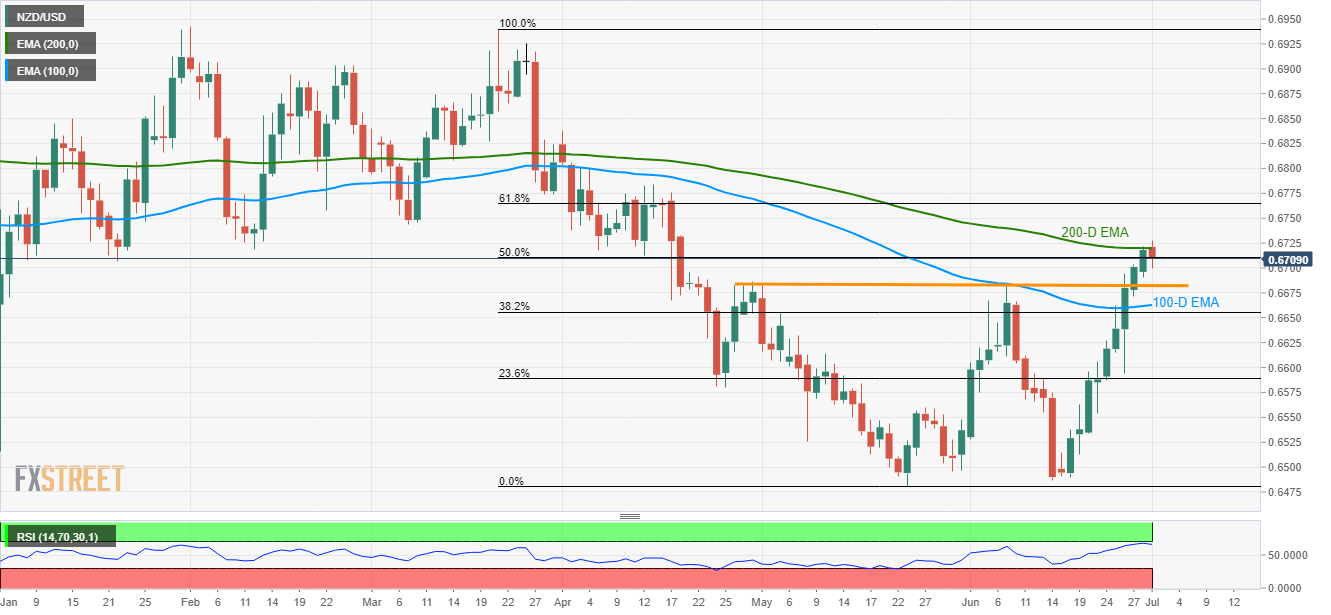
The NZD/USD pair’s failure to cross 200-D EMA, amid overbought RSI, currently drags the quote downwards to 0.6708 ahead of the European open on Monday.
A daily closing below 50% Fibonacci retracement of March-May downpour, at 0.6710, opens the door for the pair’s fresh declines towards 0.6686/82 horizontal support comprising highs marked since late-April.
In a case, sellers keep dominating past-0.6682, 100-day exponential moving average (100-D EMA) level of 0.6663 and 0.6615/10 may become their favorites.
On the flipside, pair’s sustained break above 200-day exponential moving average (200-D EMA) level of 0.6720 can propel prices to 61.8% Fibonacci retracement, at 0.6764.
During the pairs extended rise past-0.6764, 0.6800 and April month high near 0.6830 should be given proper attention if holding the long positions.
NZD/USD daily chart
Trend: Pullback expected
