- Multiple lows marked since early-April can trigger the USD/INR pair’s pullback amid oversold RSI.
- Short-term upside capped by 21-D EMA and 23.6% Fibonacci retracement confluence around 69.37/38.
Even after declining to an 11-week low, the USD/INR pair refrains from further downside as three-month-old horizontal support plays its role while the quote trades near 68.91 ahead of Europe open on Monday.
Not only 68.85/83 support-zone but oversold levels of 14-day relative strength index (RSI) also brighten the odds of the pair’s U-turn.
In doing so, early-June low near 69.03/05 may act as immediate resistance prior to pushing buyers towards 69.37/38 confluence region including 21-day exponential moving average (21-D EMA) and 23.6% Fibonacci retracement of December 2018 to March 2019 south-run.
In a case where Bulls manage to cross 69.38 upside barrier, 200-D EMA level of 69.83 could flash on their radar.
Meanwhile, sustained downpour beneath 68.83 can visit March 26 low of 68.71 whereas the current year bottom surrounding 68.34 may please bears afterward.
USD/INR daily chart
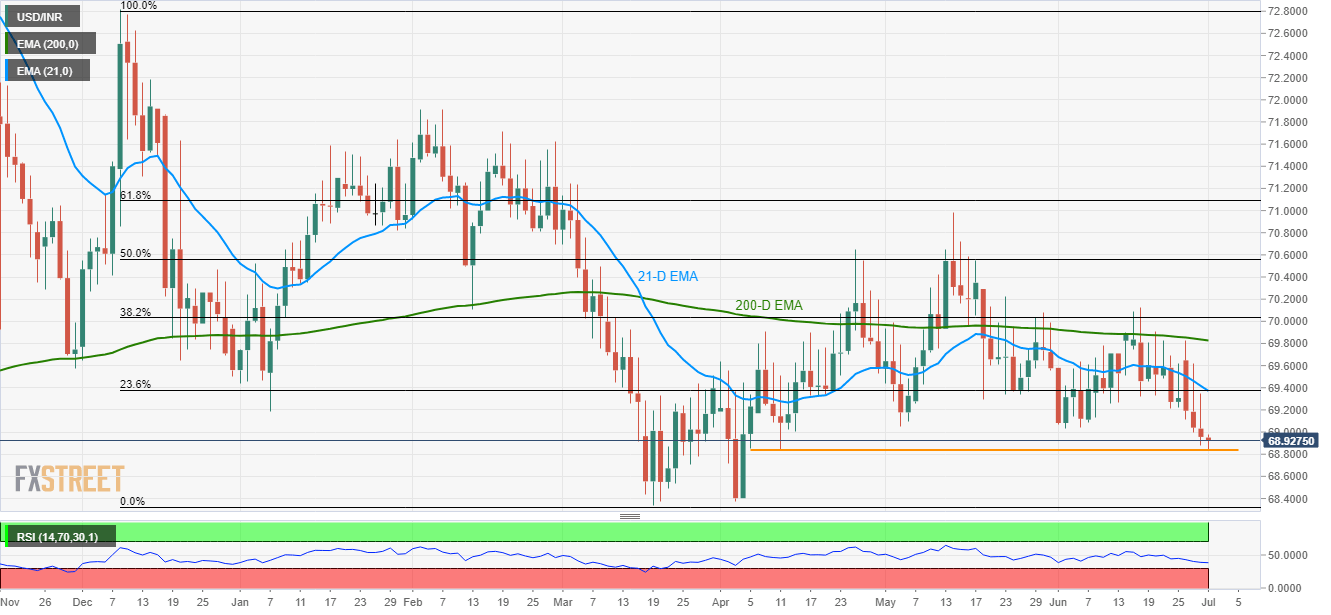
Trend: Pullback expected
