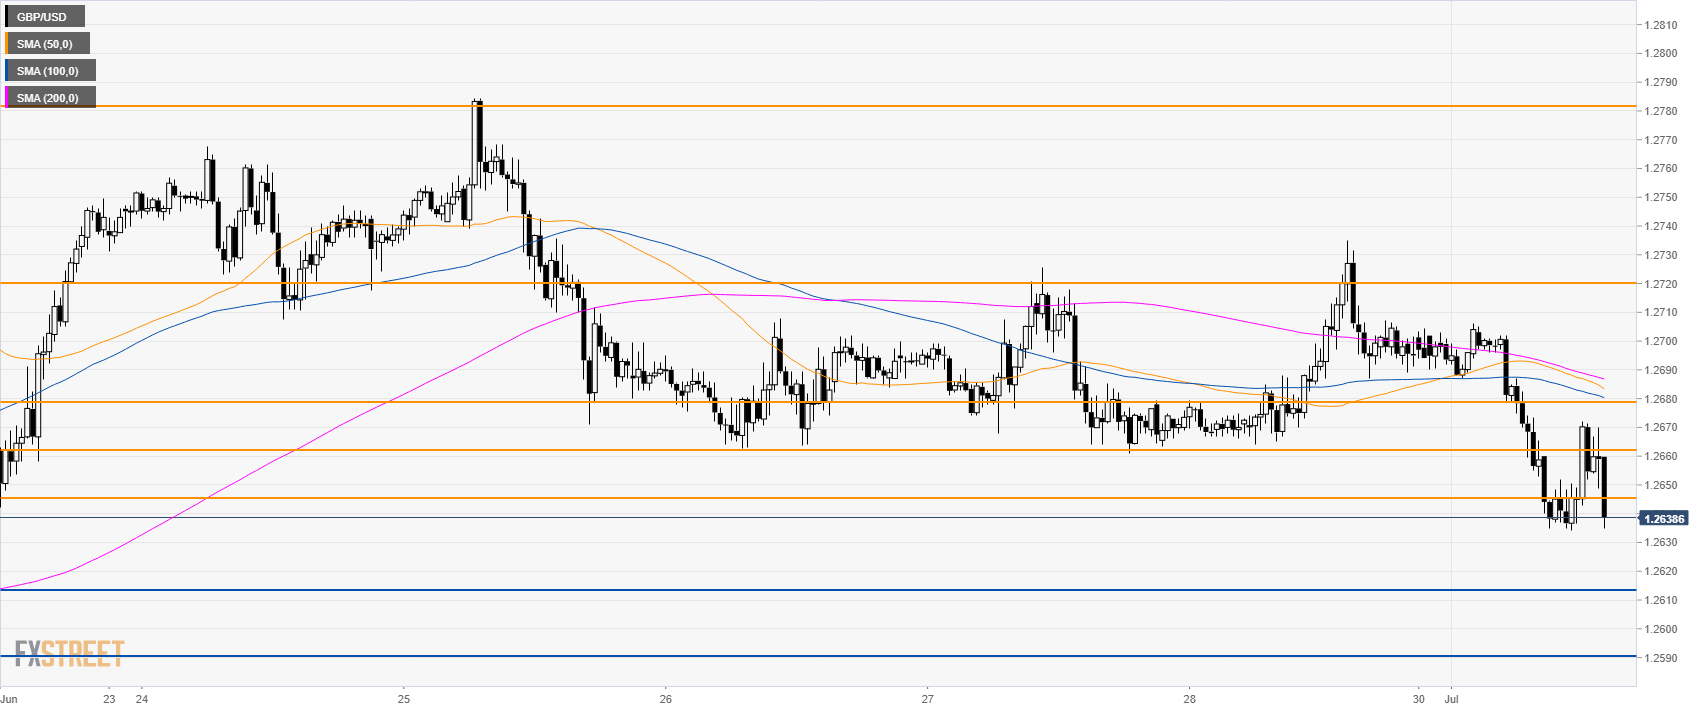
- GBP/USD is under pressure below the 1.2700 handle.
- Bears need to break below 1.2645 support.
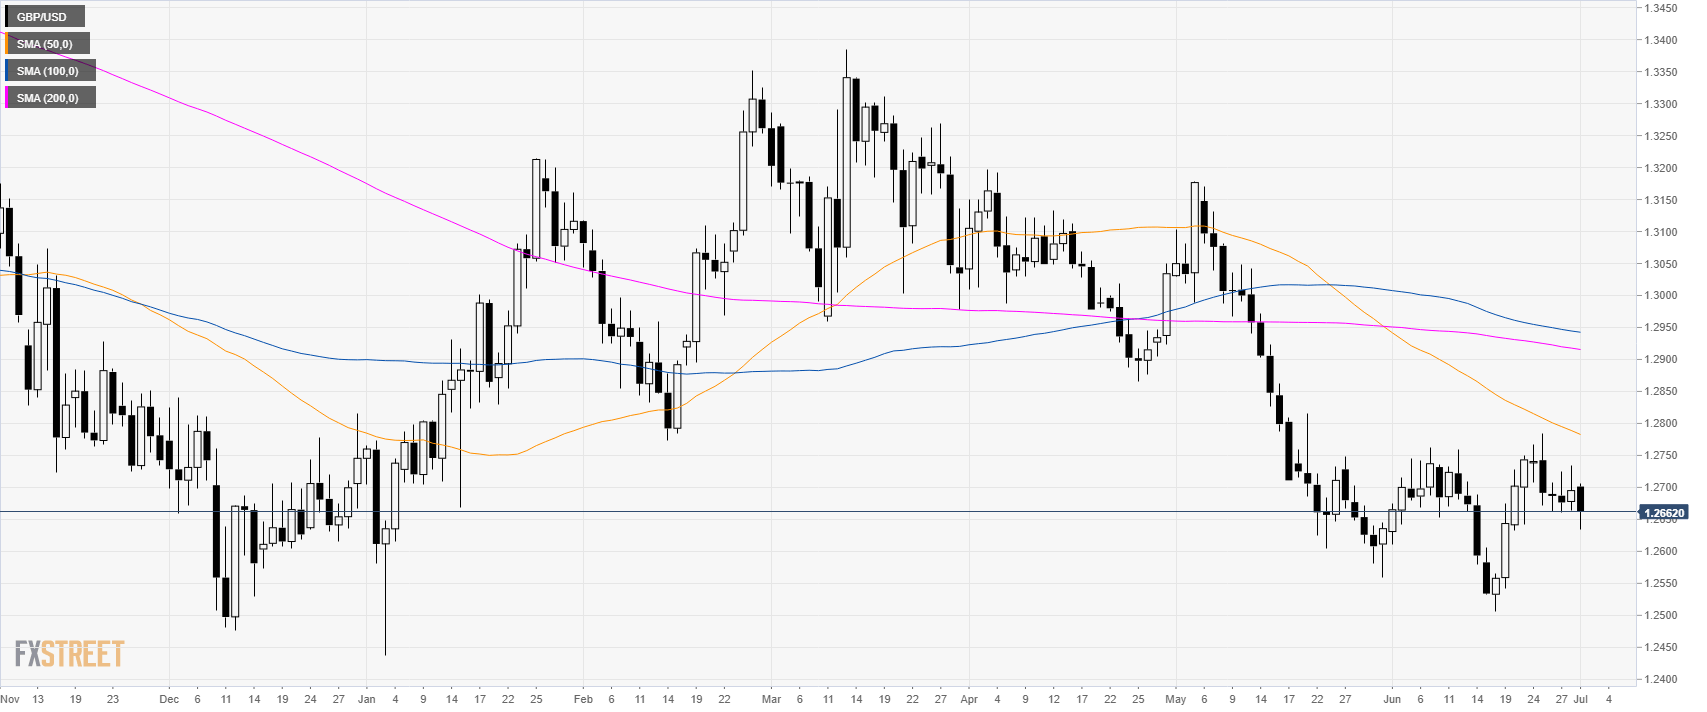
GBP/USD daily chart
GBP/USD is in a bear trend below the main daily simple moving averages (DSMAs). The market is trading below the 1.2700 figure.
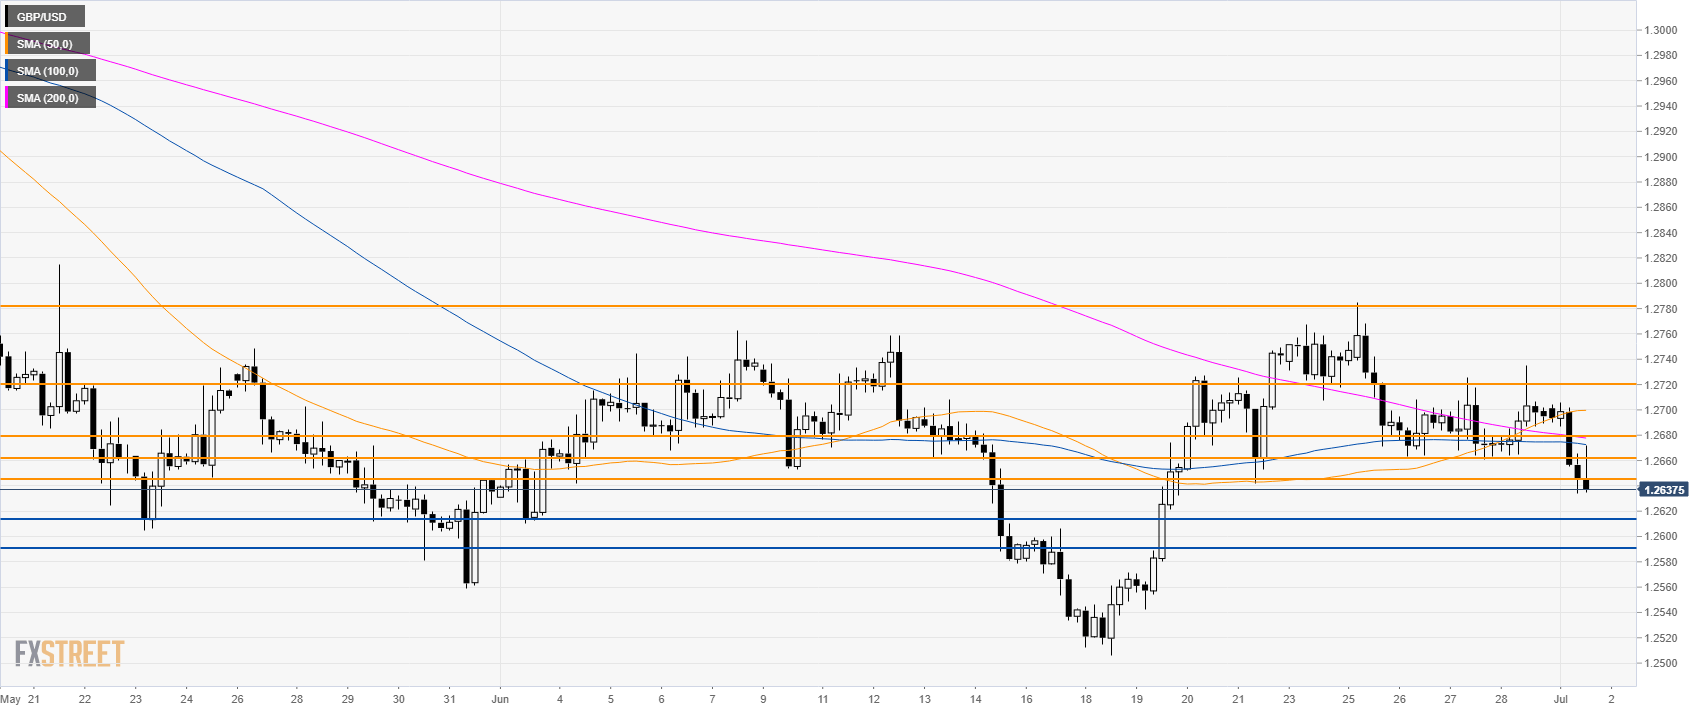
GBP/USD 4-hour chart
Cable is trading below its main SMAs suggesting bearish momentum in the medium term. Bears ant to surpass 1.2645 to reach 1.2613 and 1.2590, according to the Technical Confluences Indicator.
GBP/USD 30-minute chart
GBP/USD is under pressure below its main SMAs. Resistance is at 1.2660, 1.2680 and 1.2720, according to the Technical Confluences Indicator.
Additional key levels
