- The US Dollar Index (DXY) is gaining bullish momentum above its 200 DSMA
- Immediate resistance is at the 96.74 and 97.00 levels.
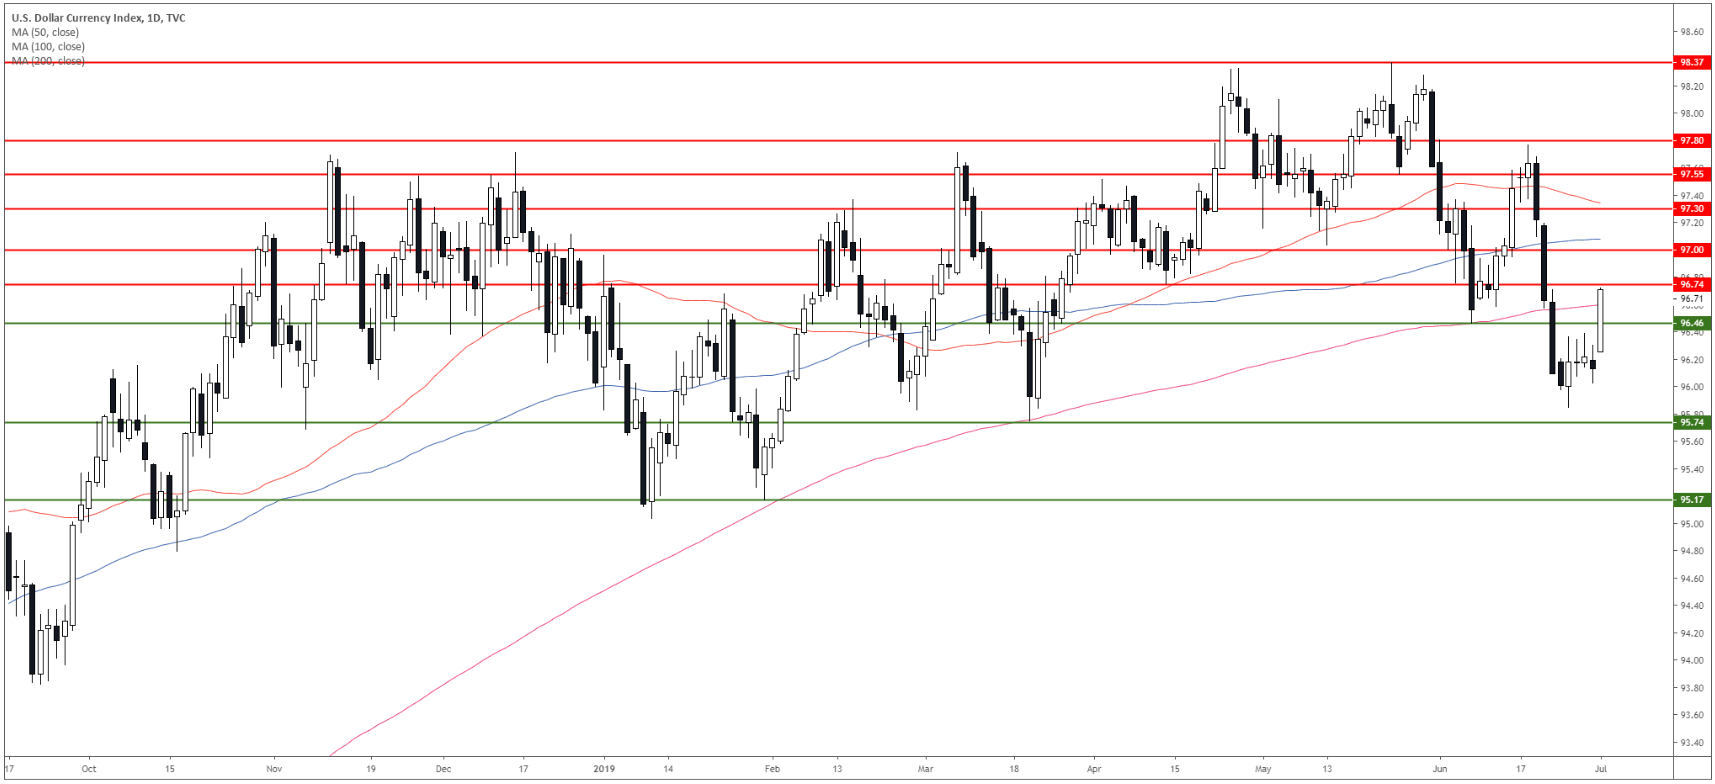
DXY daily chart
The US Dollar Index (DXY) is regaining the 96.46 key resistance and the 200-day simple moving average (DSMA) suggesting a potential resumption of the bull trend.

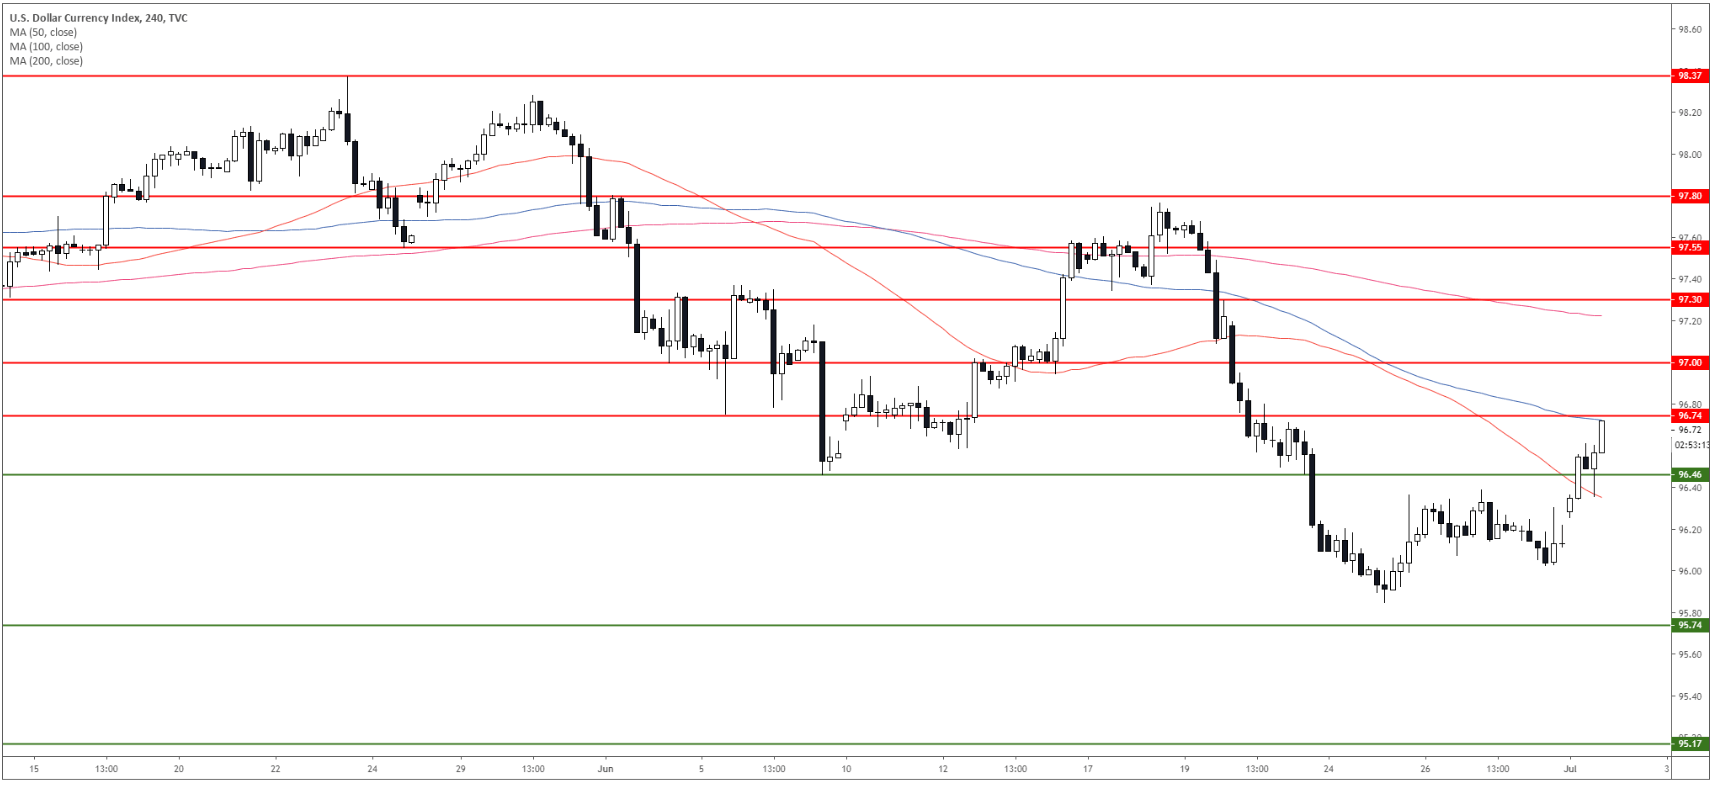
DXY 4-hour chart
DXY is testing 96.74 resistance and the 100 SMA. As the bulls are gathering strength the next resistance to the upside are seen at 97.00 and 97.30.

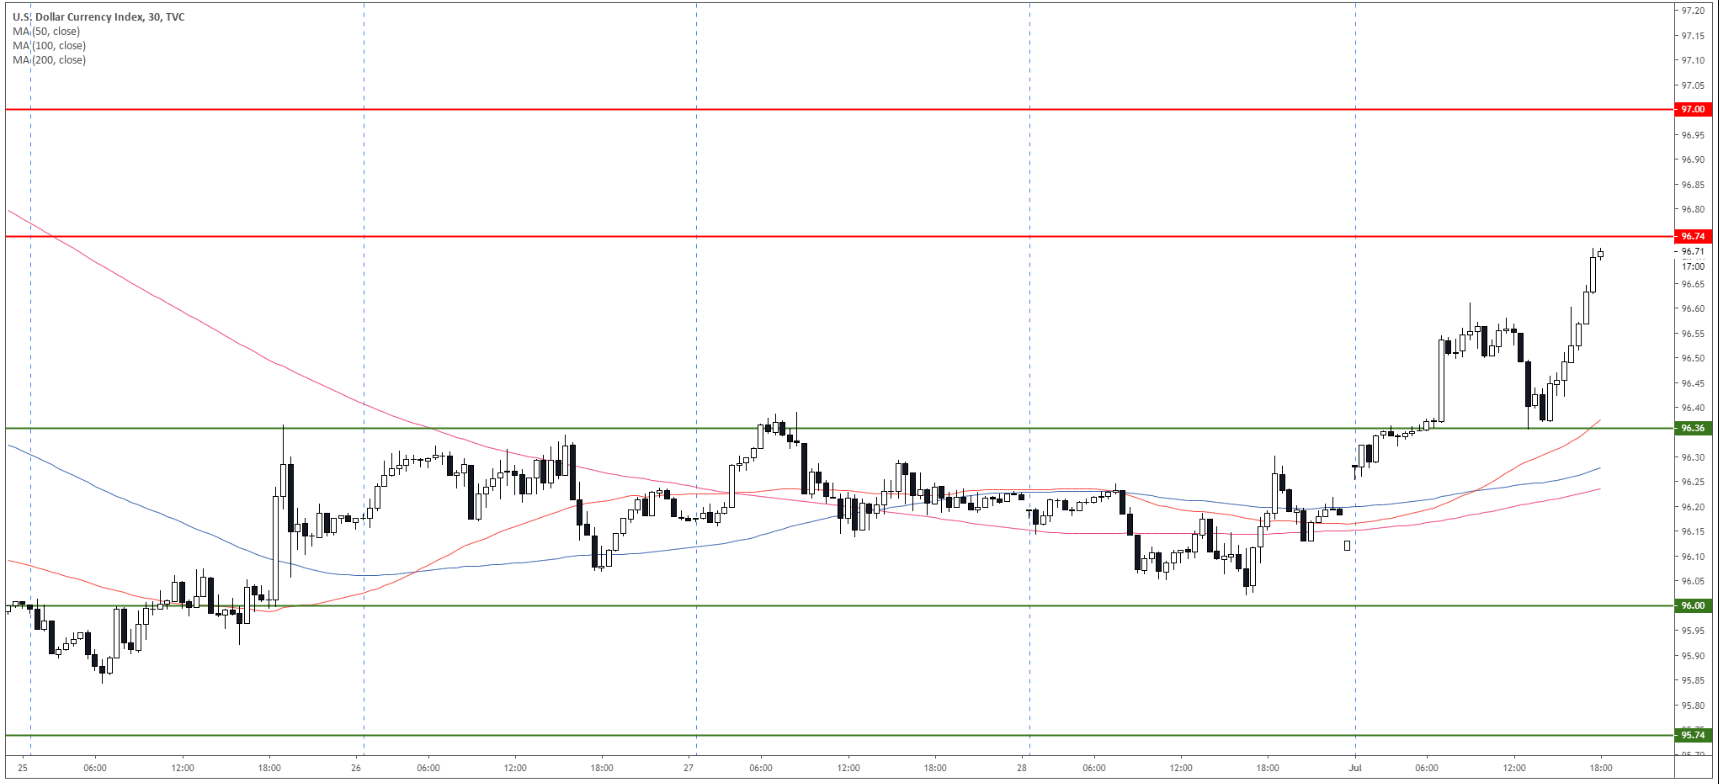
DXY 30-minute chart
The market is under bullish pressure above its main SMAs. Support is at 96.36 and the 96.00 figure.

Additional key levels