- Sustained trading below 76.34/40 portrays the AUD/JPY weakness.
- 21-D EMA can limit immediate downside on the break of 23.6% Fibonacci retracement.
Following its U-turn from 76.28, the AUD/JPY pair tests 23.6% Fibonacci retracement of its April-June downpour while taking the rounds to 75.51 amid initial Asian session on Tuesday.
Even if the 14-day relative strength index (RSI) fails to offer any major clues, pair’s sustained trading below 76.34/40 region comprising high of May 20 and low of May 09 portrays the quote’s weakness that can drag it to 21-day exponential moving average (21-D EMA) level of 75.26.
Should prices fail to respect the short-term moving average (MA) support, June 03 low near 75.00 and a fortnight old ascending trend-line at 74.72 may entertain sellers ahead of challenging them with June month’s bottom surrounding 73.92.
On the upside clearance of 76.40, prices can quickly rise to 100-D EMA level of 77.10.
Additionally, pair’s sustained trading beyond 77.10 enables it to confront 50% Fibonacci retracement of 77.34 and May 07 high close to 78.05.
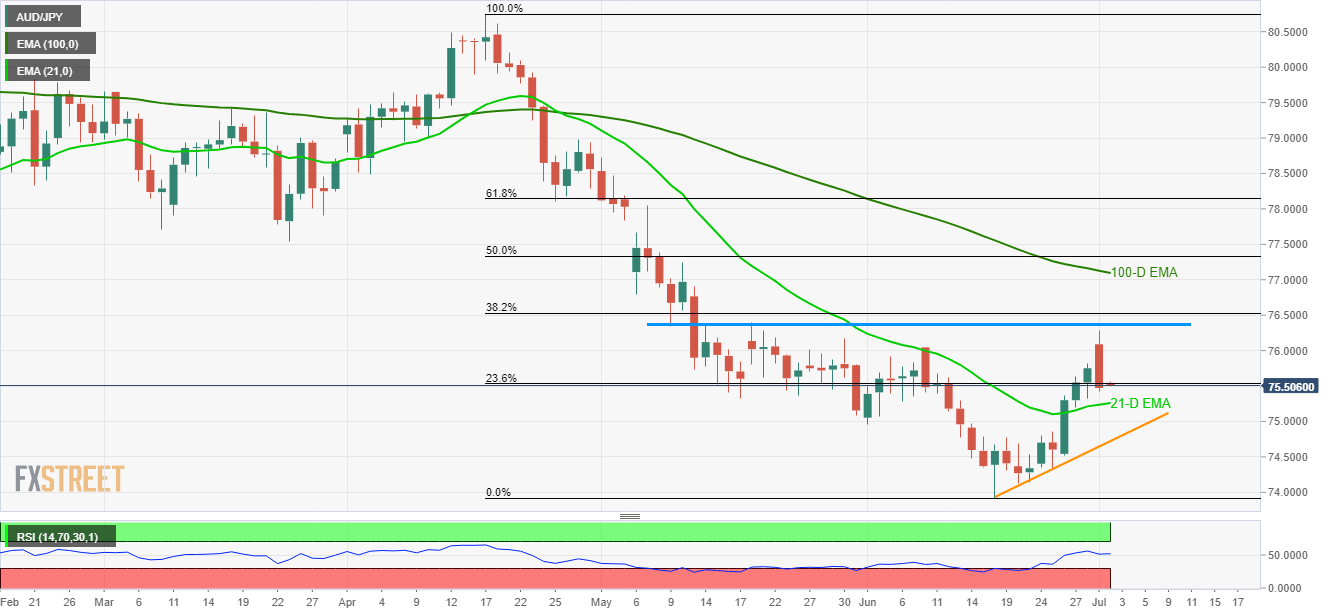
AUD/JPY daily chart
Trend: Bearish
