- USD/IDR buyers can’t take over unless breaking 21/100-day SMA confluence.
- Immediate lows, 23.6% Fibo. may challenge bears.
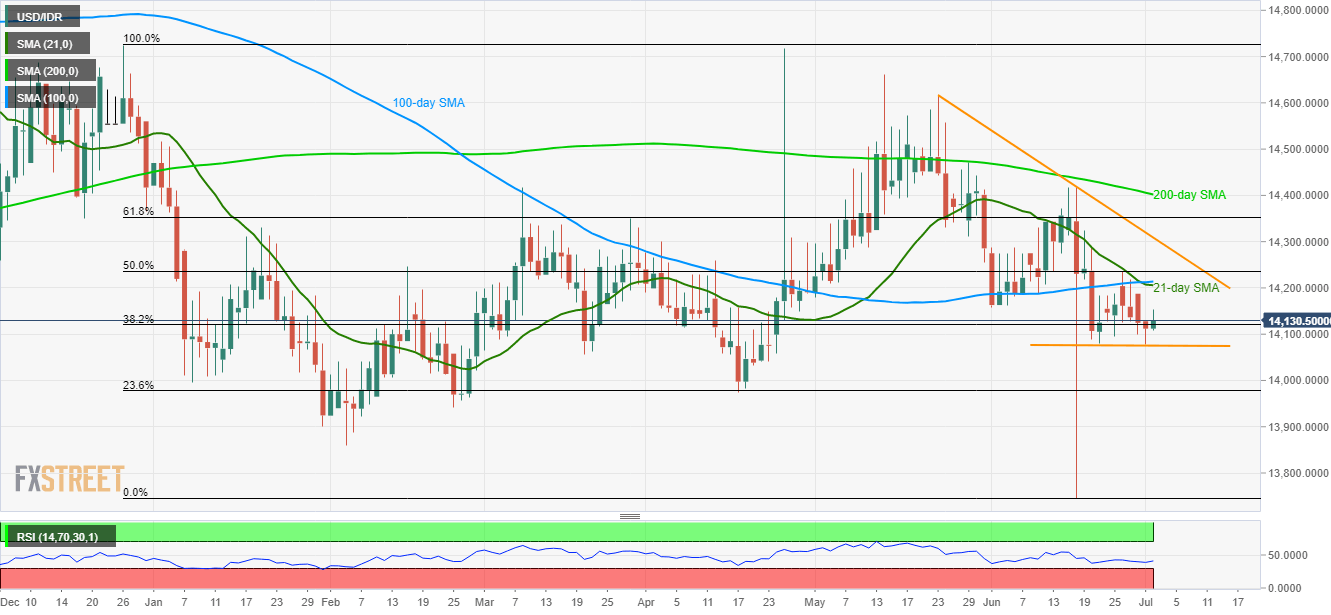
Sustained trading beneath 21 and 100-day simple moving average (SMA) confluence keeps dragging the USD/IDR downwards as it trades near 14,108 during early Tuesday.
However, horizontal support comprising latest lows can limit the pair’s further declines around 14,080/78, if not then 23.6% Fibonacci retracement of current year downpour, at 13,978, can flash on bears’ radar.
Given the pair’s extended south-run below 13,978, February month low near 13,860/59 can come back on the chart.
On the contrary, pair’s successful break of 14,205/13 area including key SMA can propel the quote further up towards five-week-old descending trend-line resistance of 14,309.
In a case where prices rally beyond 14,309, the 200-day SMA level of 14,401 should gain market attention.
USD/IDR daily chart
Trend: Bearish
