- Lower high formation from 50-D EMA favors the GBP/USD pair’s further declines.
- RSI also takes U-turn towards the south.
Following its failure to cross 50-day exponential moving average (50-D EMA), the GBP/USD pair drops to 13-day low before taking the rounds to 1.2635 heading into the UK open on Tuesday.
The 14-day relative strength index (RSI) takes a U-turn towards the south, indicating brighter chances of further selling pressure.
Also, the pair’s lower high formation since the reversal on June 25 increases the probability of its decline to June 17 high of 1.2607. However, horizontal-line connecting multiple lows marked since early-January at 1.2580 could become bears’ favorite during further south-run
In a case where prices keep being on a back foot below 1.2580, June month bottom surrounding 1.2506 may come back on the chart.
Alternatively, 1.2710 and 50-day EMA level of 1.2764 act as immediate key resistances.
Should there be a successful rise beyond 1.2764, 61.8% Fibonacci retracement of January to March month upside at 1.2800 and 100-D EMA level of 1.2850 can gain buyers’ attention.
GBP/USD daily chart
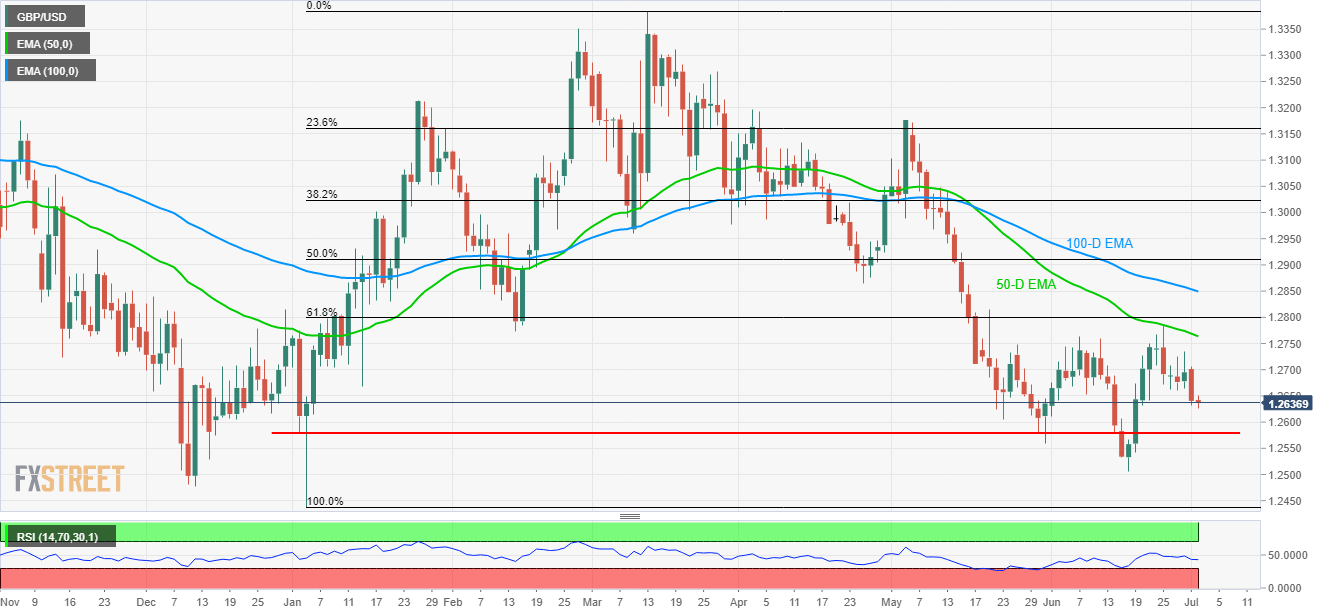
Trend: Bearish
