- The US Dollar Index (DXY) is gaining some traction above its 200 DSMA.
- Immediate resistances are at the 97.00 and 97.30 levels.
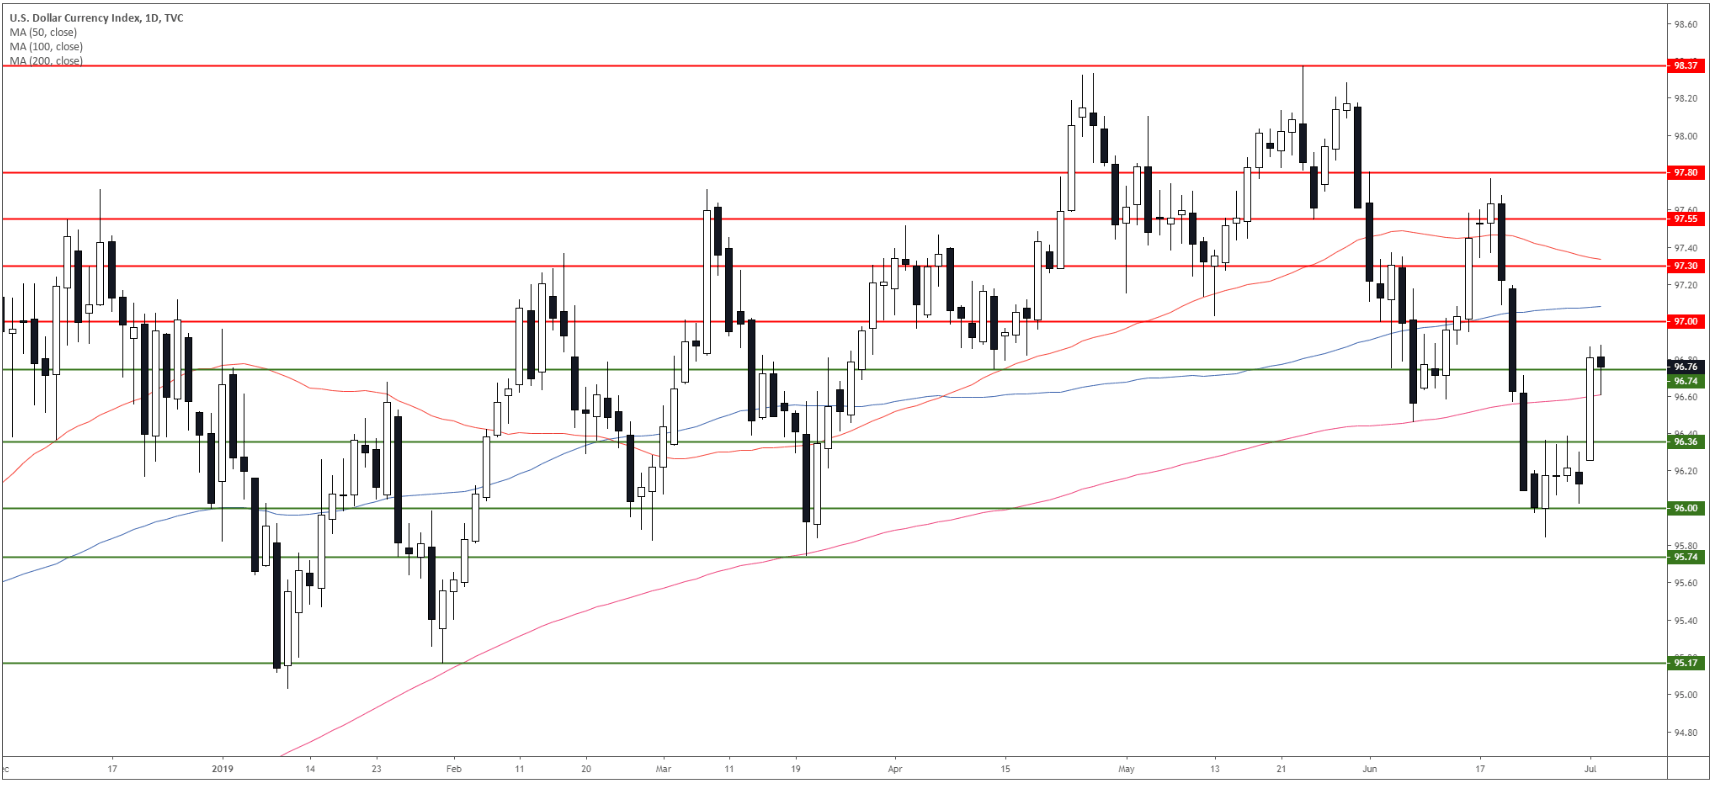
DXY daily chart
The US Dollar Index (DXY) is trading just above 96.74 resistance while trading above the 200-day simple moving average (DSMA), all-in-all suggesting a potential resumption of the bull trend.

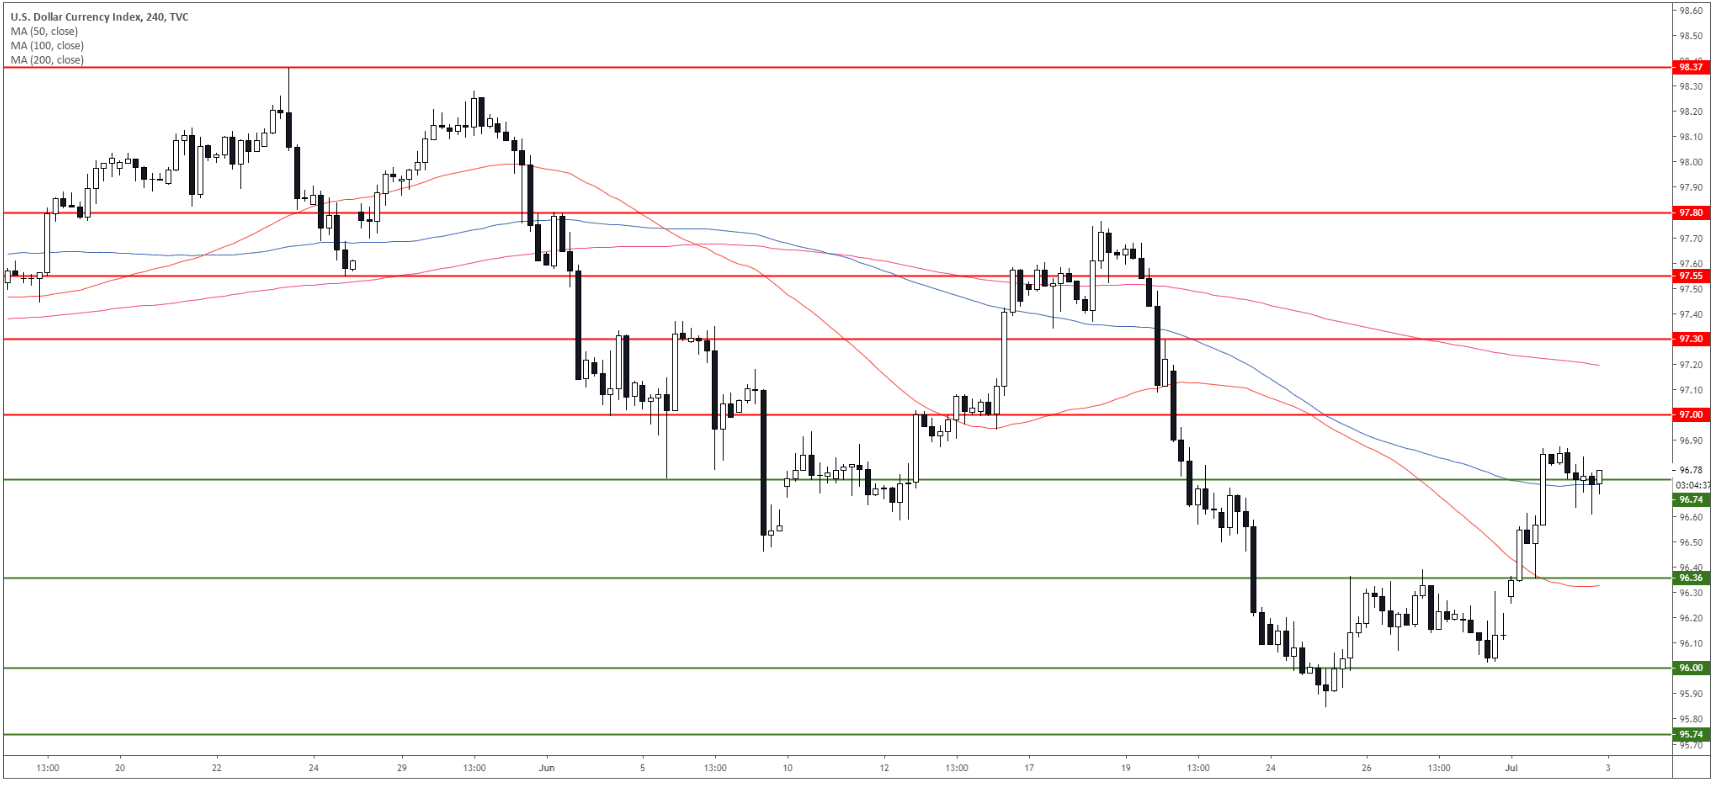
DXY 4-hour chart
DXY is supported near 96.74 and the 100 SMA. As the buyers are gaining some ground the next resistance to the upside are seen at the 97.00 and 97.30 levels.

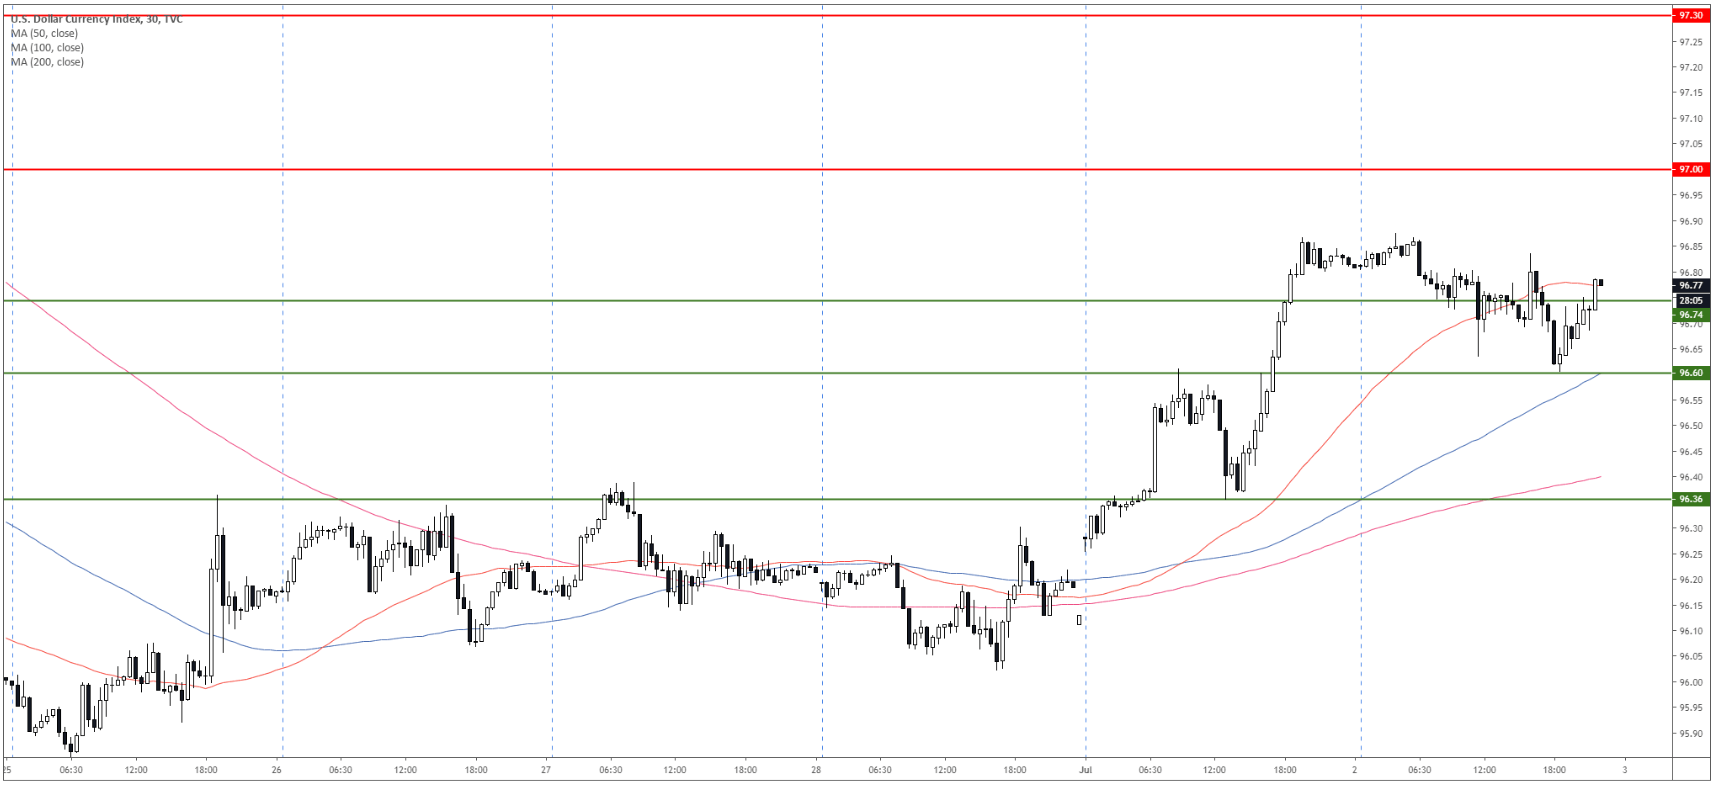
DXY 30-minute chart
The market is bullish above its main SMAs. On the way down, support is seen at 96.60 and 96.36.

Additional key levels