- NZD/USD’s hourly chart shows falling channel breakout.
- The pullback from recent highs seems to have ended.
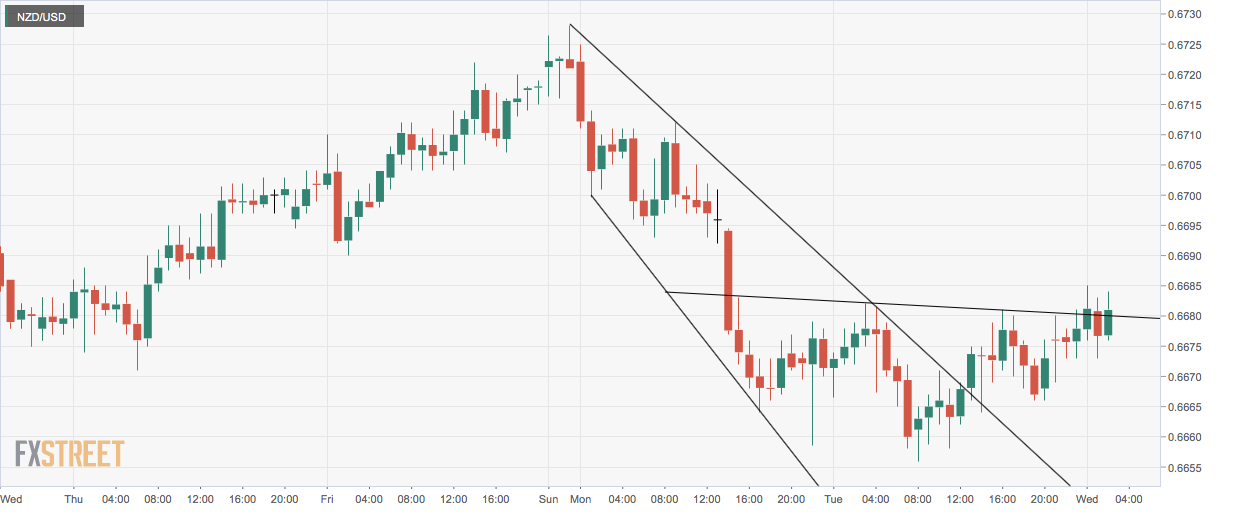
NZD/USD is attempting a break above the 50-hour moving average of 0.6680 at press time, having witnessed a falling channel breakout on the hourly chart on Tuesday.
Further, the pair is now teasing an inverse head-and-shoulders breakout on the hourly chart.
So, it appears the pullback from the recent high of 0.6727 has ended and the bulls have regained control.
The pair, therefore, could rise further to levels above 0.67 during the day ahead.
The bullish case would weaken if the pair finds acceptance below 0.6666.
Hourly chart
Trend: Bullish
Pivot points
