- Sustained trading beneath 38.2% Fibonacci retracement, 21-D EMA portrays selling pressure.
- RSI’s U-turn towards south also favors the sellers.
Having slipped beneath 38.2% Fibonacci retracement of December – April upside and 21-D EMA, WTI remains on a back foot while taking the rounds to $56.40 ahead of the European open on Wednesday.
Considering the sustained trading beneath key short-term technical levels and downward sloping, but not oversold, levels of 14-day relative strength index (RSI), the black gold is likely declining towards 50% Fibonacci retracement level of $54.53.
It should, however, be noted that the quote’s downpour below $54.53 may find multiple supports around $53.00, a break of which can open the door for the benchmark’s slump to 61.8% Fibonacci retracement of $51.67.
During the upside, a successful break of $56.75 including 21-day exponential moving average (21-D EMA) becomes necessary for buyers to aim for latest high of $60.26 and 23.6% Fibonacci retracement level of $60.92.
Given the price rally beyond $61.00 round-figure, May month top around $63.80 and the yearly high close to $66.60 might lure the bulls.
WTI daily chart
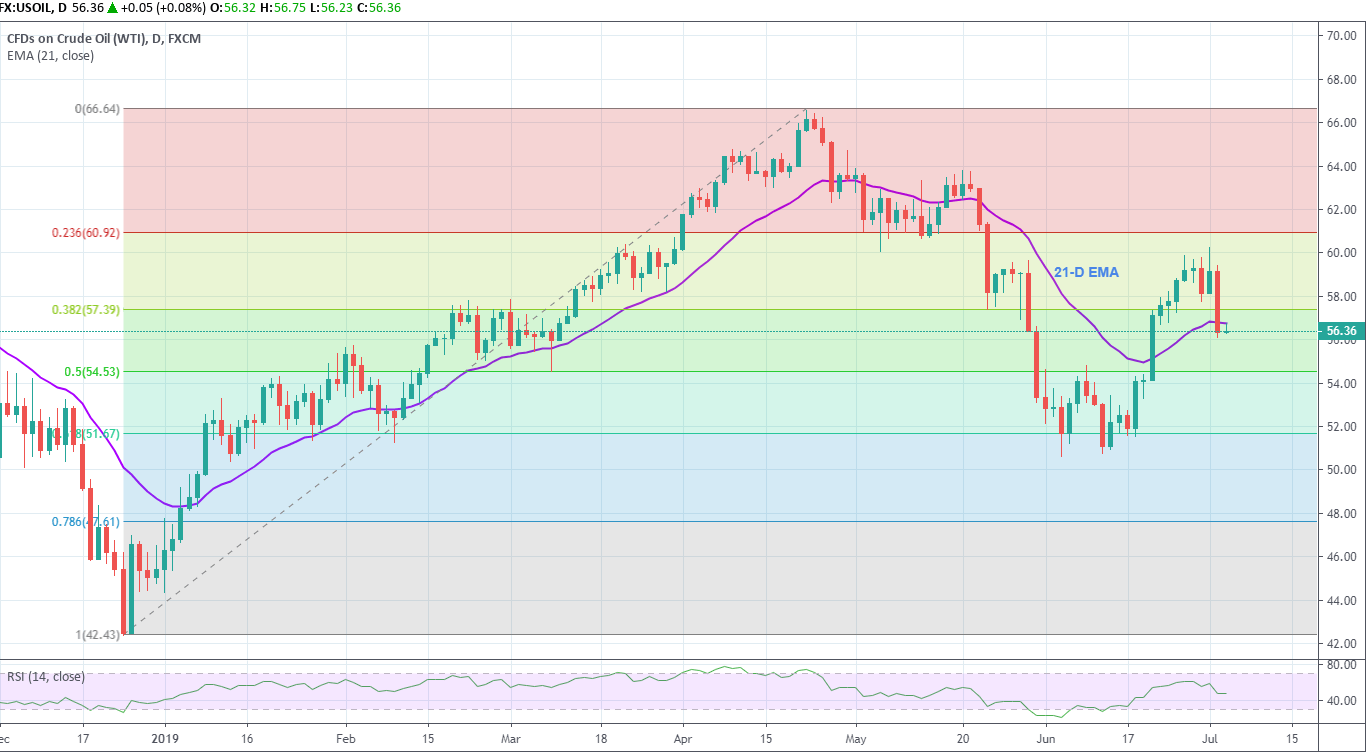
Trend: Bearish
