- The break of 61.8% Fibonacci retracement, 5-day long descending trend-line portrays the GBP/USD weakness.
- Nearness to short-term key supports, oversold RSI offer a buying opportunity.
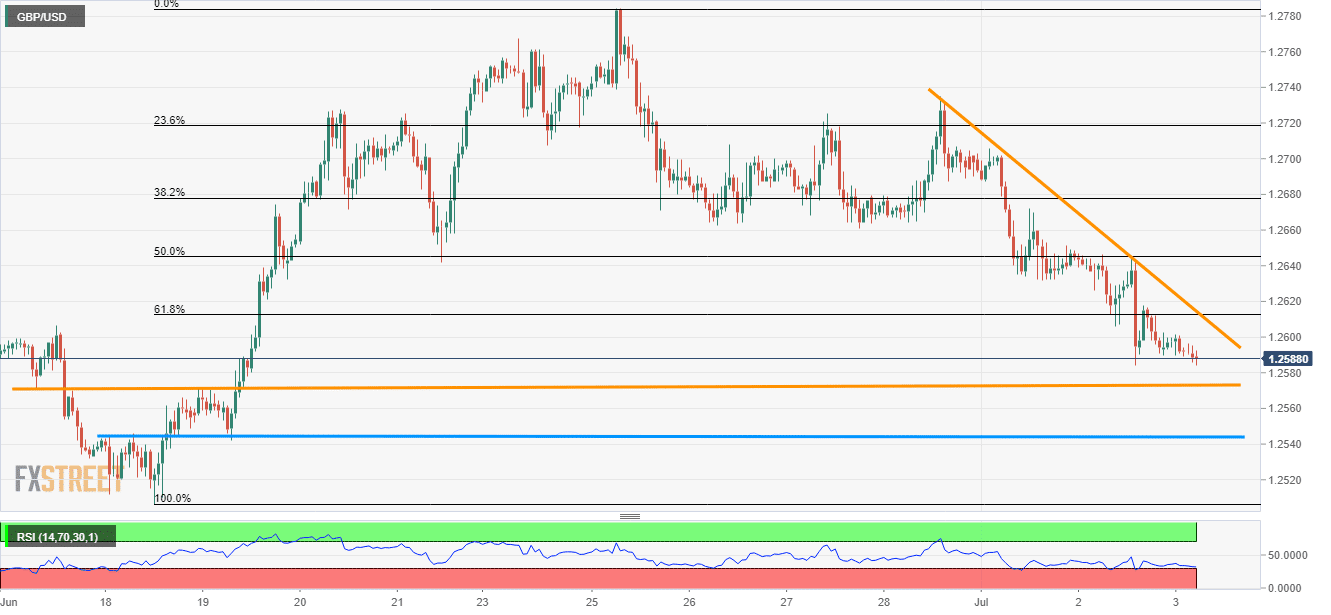
Despite trading close a fortnight low, oversold RSI and immediate key supports can trigger the GBP/USD pair’s U-turn as it takes the rounds to 1.2588 while heading into the UK open on Wednesday.
Among the resistances, 1.2612/15 region grabs immediate attention as it comprises 61.8% Fibonacci retracement level of late-June upside and 5-day old descending trend-line.
Should buyers manage to cross 1.2615, multiple levels surrounding 1.2660/65 may limit the quote’s further advances, if not then June 28 high around 1.2735 and the June moth top close to 1.2785 should become bulls’ favorites.
Alternatively, bears’ refrain from respecting 14-bar relative strength index (RSI) can drag prices further down to 1.2570 and 1.2545 horizontal lines connecting various extremes since mid-June.
Given the pair’s extended south-run below 1.2545, June 18 low of 1.2506 may come back on the chart.
GBP/USD hourly chart
Trend: Pullback expected
