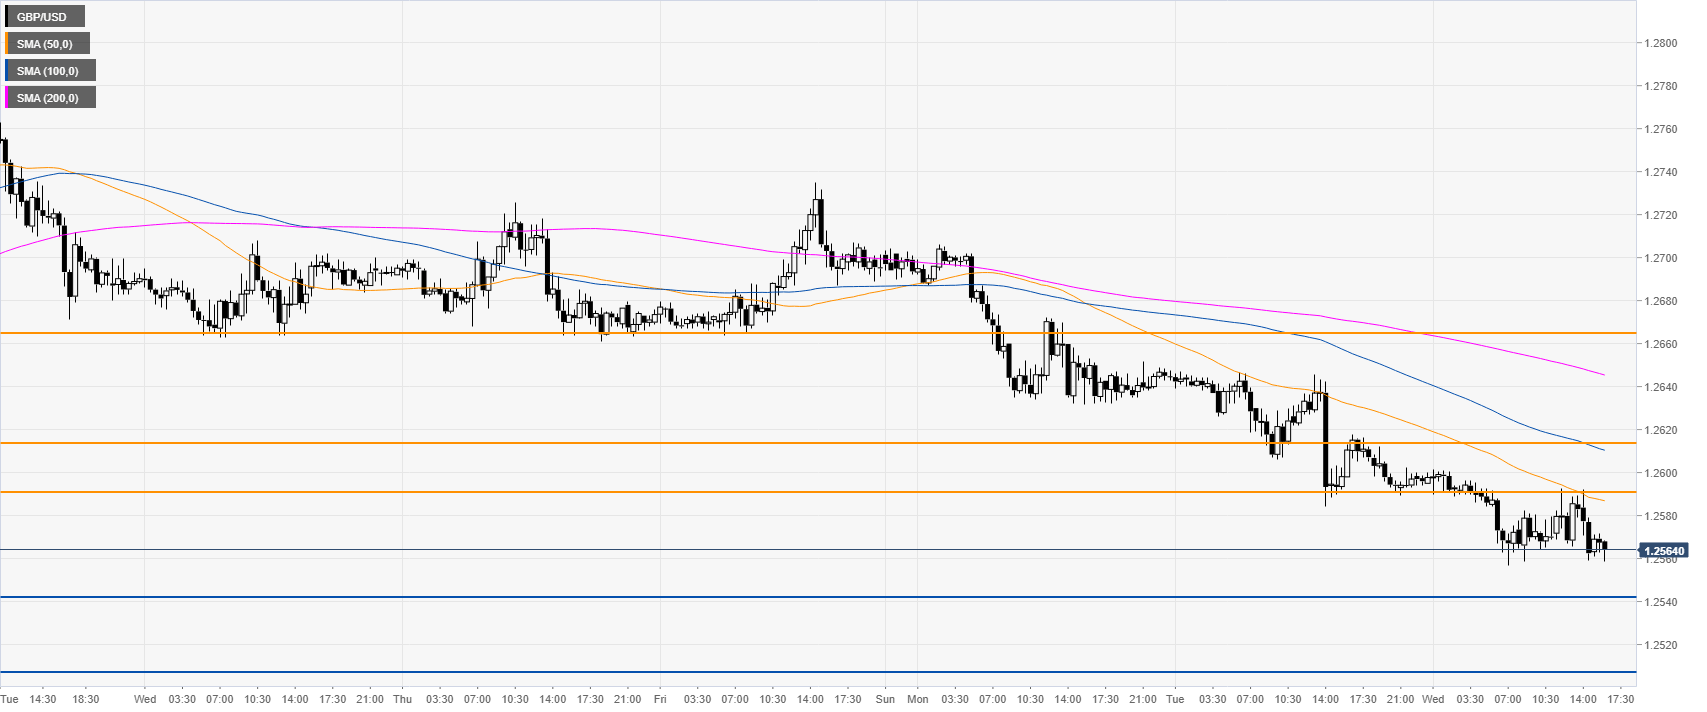
- GBP/USD is under bearish pressure below the 1.2600 handle.
- Cable is currently challenging the daily low near 1.2560 support.
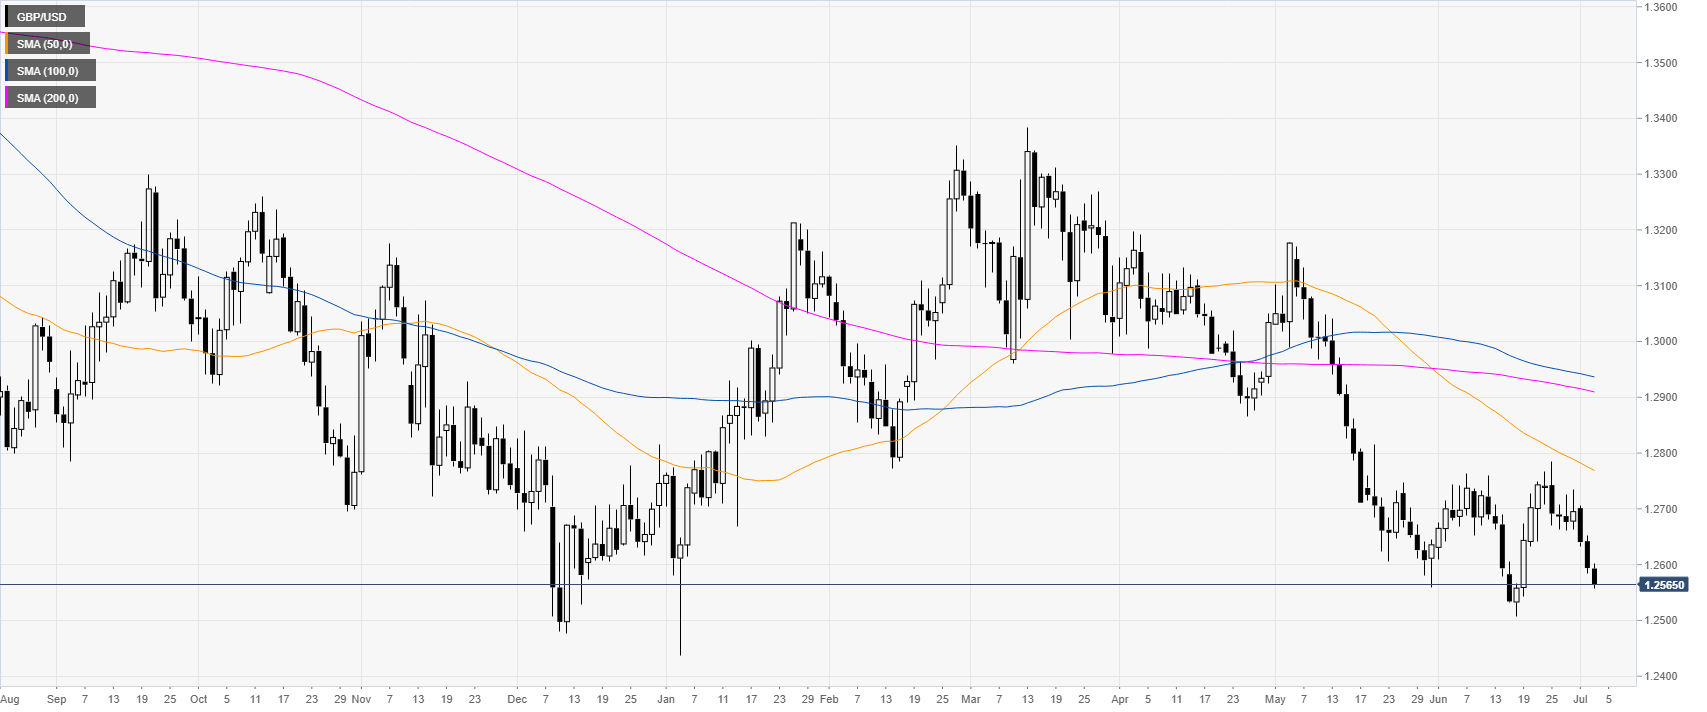
GBP/USD daily chart
GBP/USD is in a bear trend below the main daily simple moving averages (DSMAs). The market remains under selling pressure below the 1.2600 figure.
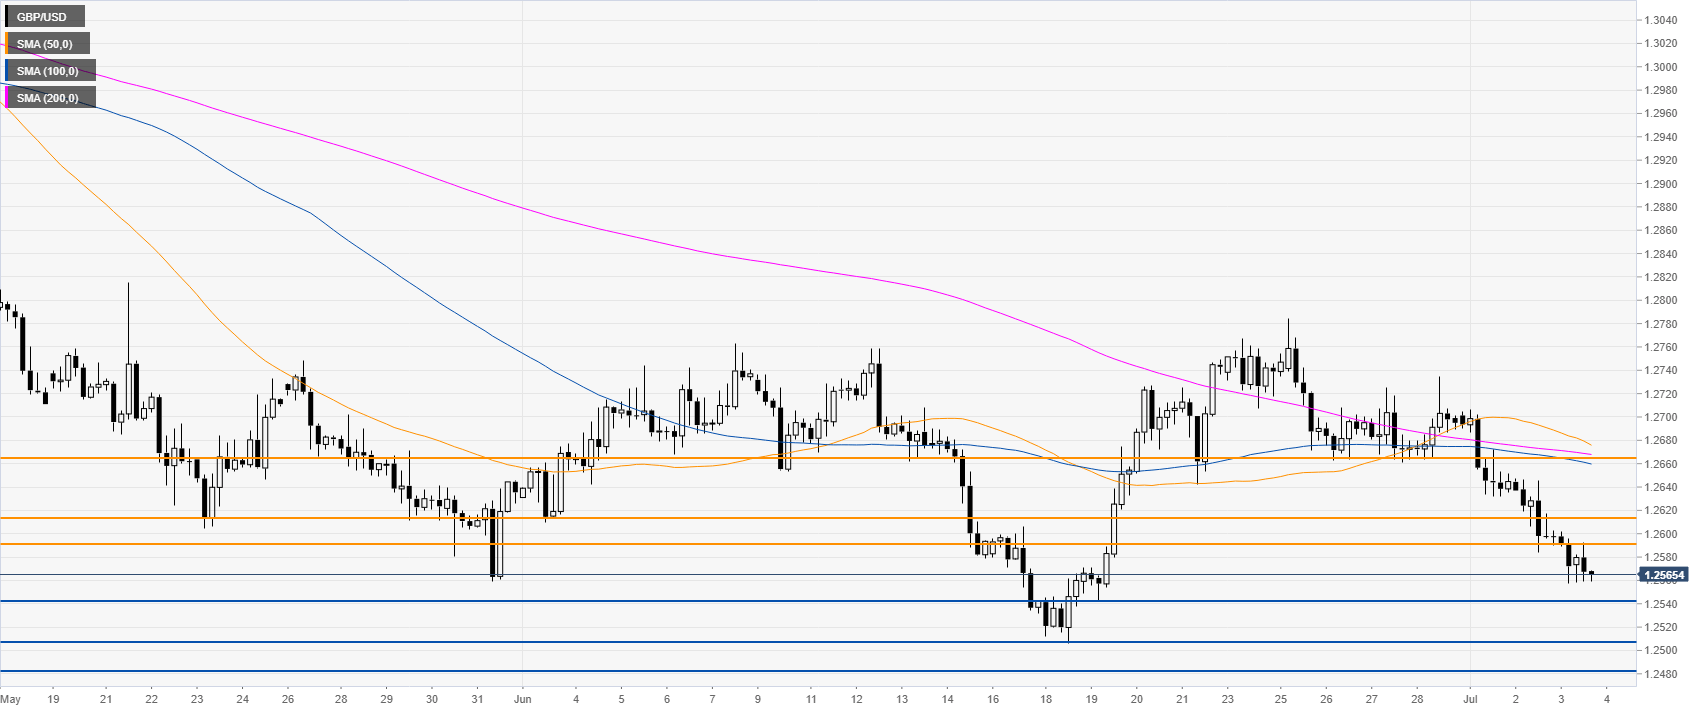
GBP/USD 4-hour chart
Cable is trading below its main SMAs suggesting bearish momentum in the medium term. The market can continue its downward trajectory towards, 1.2540, 1.2508 and potentially the 1.2482 level, according to the Technical Confluences Indicator.
GBP/USD 30-minute chart
GBP/USD is under pressure below main SMAs suggesting bearish momentum in the short term. Resistances are seen at 1.2590, 1.2613 and 1.2665, according to the Technical Confluences Indicator.
Additional key levels
