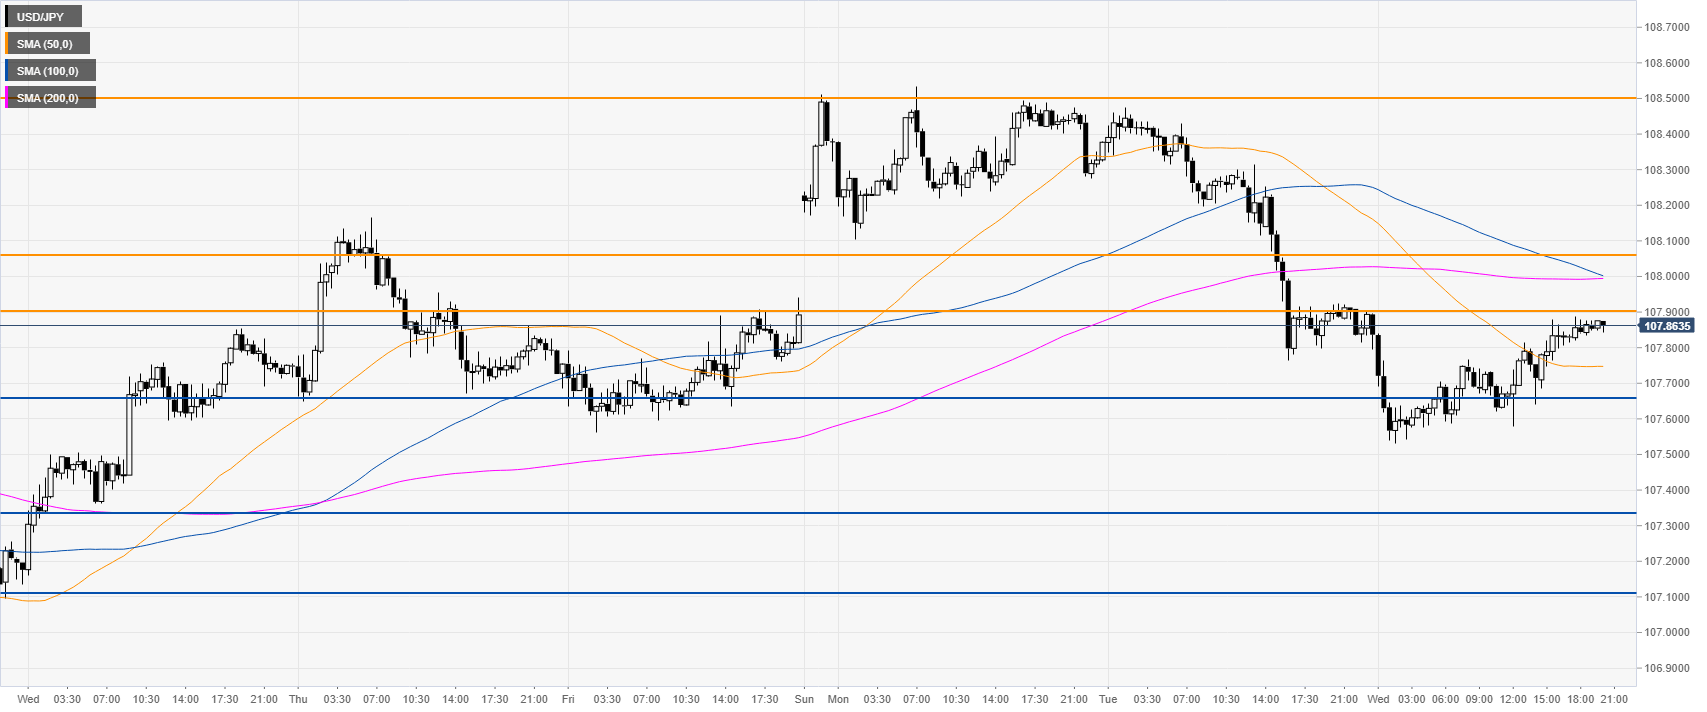
- The market recouped some of the Tuesday’s losses.
- The market will need to overcome the 107.90-108.05 resistance zone.
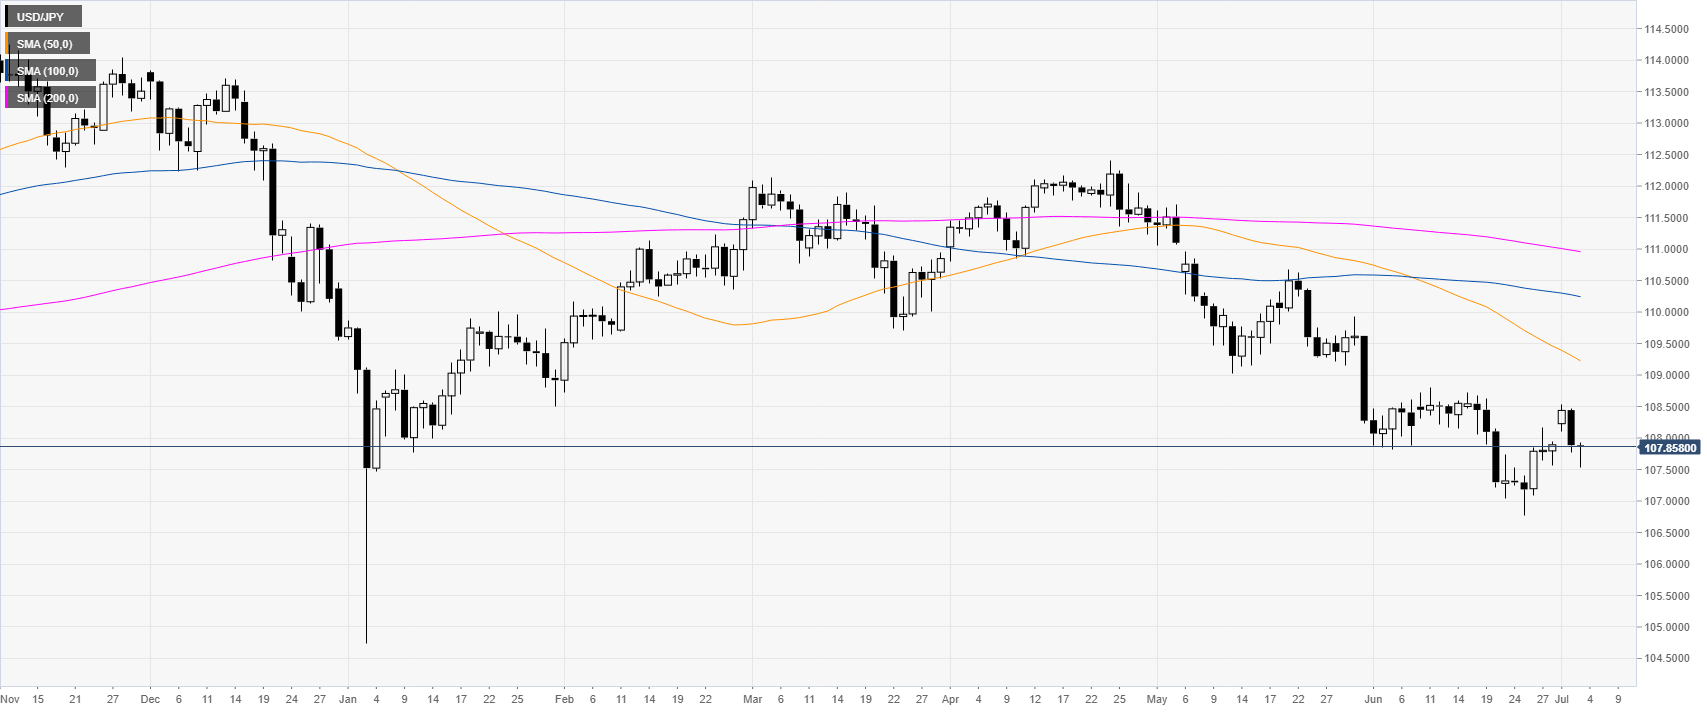
USD/JPY daily chart
USD/JPY is trading in a bear leg below its main daily simple moving averages (DSMAs). The market closed the weekly gap.
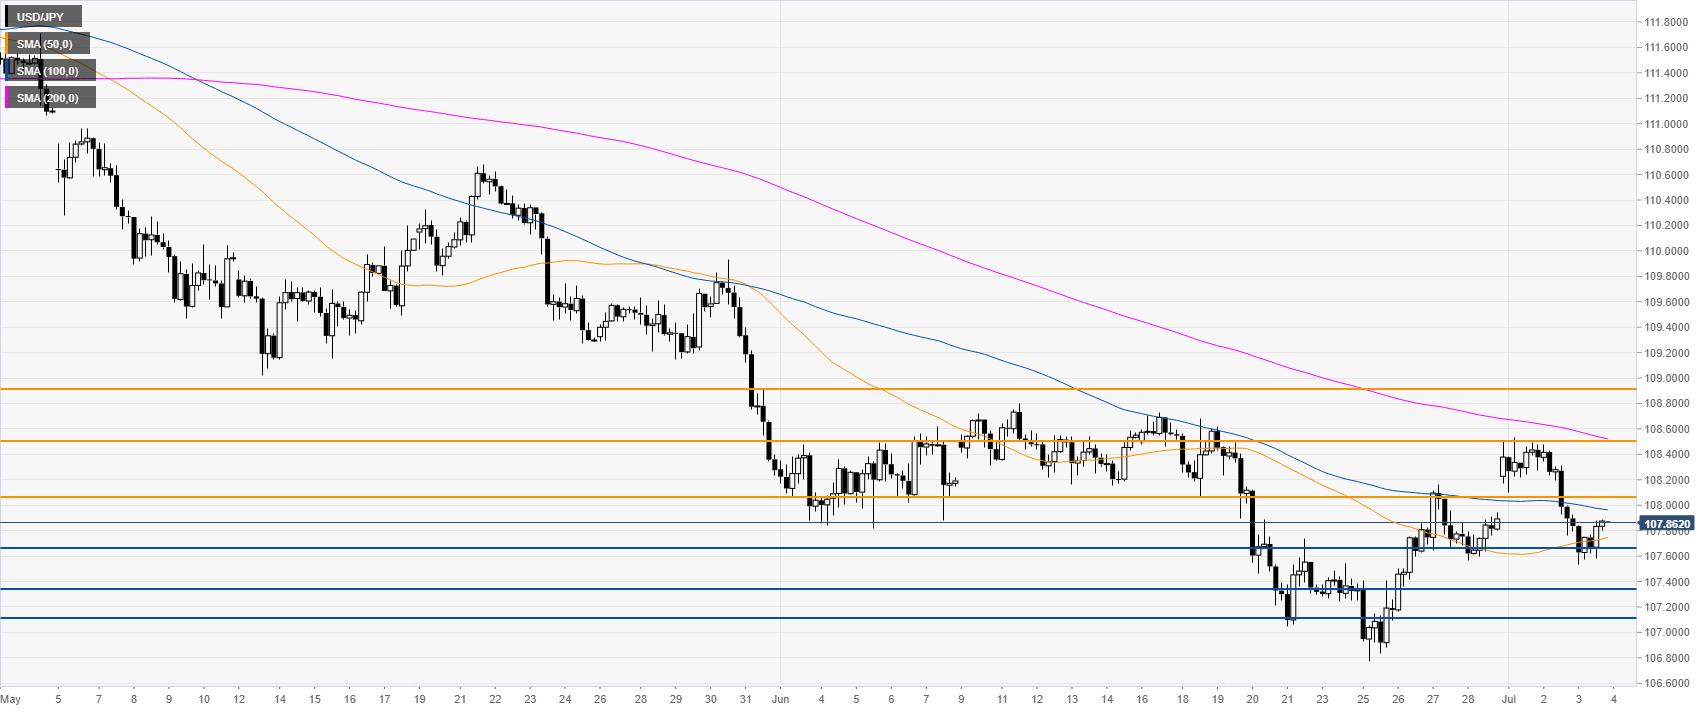
USD/JPY 4-hour chart
USD/JPY is testing 107.66 strong support. If the bears break below it the next level of support can be seen at 107.33 and 107.10, according to the Technical Confluences Indicator.
USD/JPY 30-minute chart
USD/JPY is trading below its main SMAs suggesting bearish momentum in the near term. Initial resistance can be seen in the 107.90-108.05 zone. After which the next resistance is seen at the 108.50 and the 108.90 levels, according to the Technical Confluences Indicator.
Additional key levels
