- GBP/USD is starting the week in consolidation mode.
- The main supports on the way down can be seen near the 1.2570 and 1.2617 levels.
Cable is consolidating the losses seen last Friday. The release of the June’s Nonfarm Payrolls (NFP) which came much better-than-expected sent the USD up across the board. The US economy added 224K jobs vs.160K forecast.
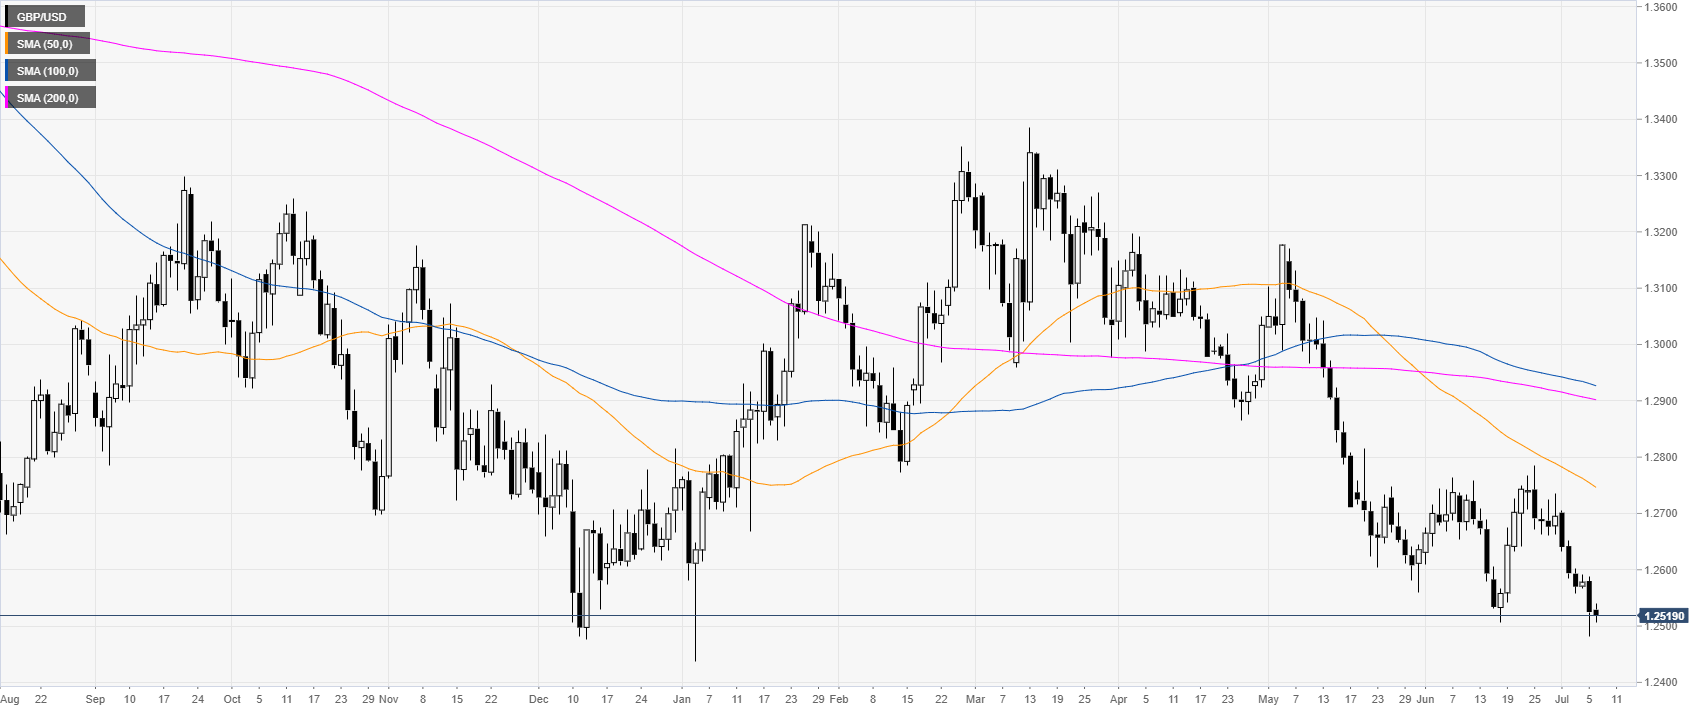
GBP/USD daily chart
GBP/USD is trading in a bear trend below its main daily simple moving averages (DSMAs). The market is now stabilizing near 1.2500.
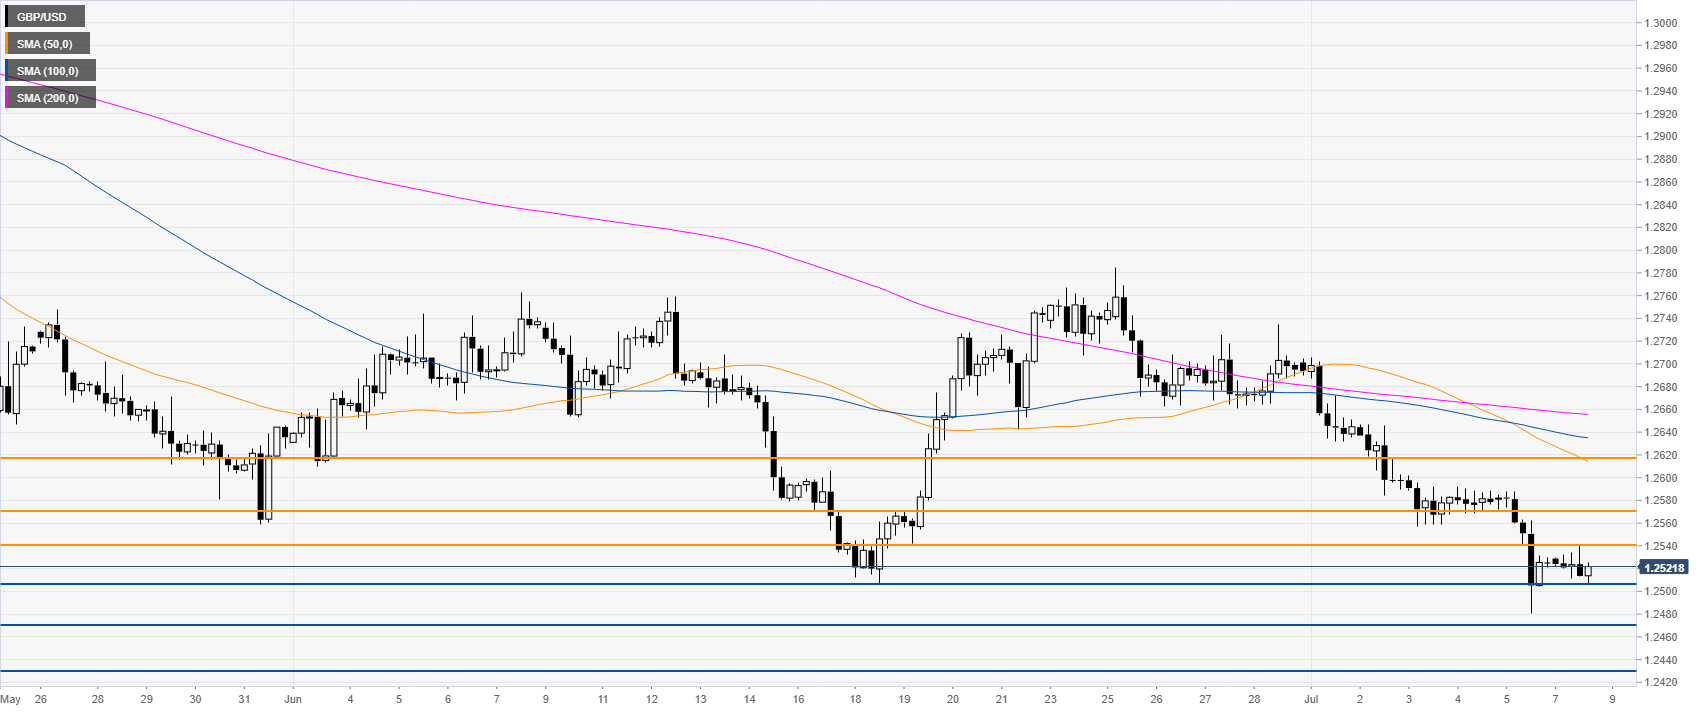
GBP/USD 4-hour chart
GBP/USD is consolidating below 1.2540 resistance and its main SMAs. Sellers need to break below 1.2507 (current daily low) to reach 1.2470 and 1.2430. according the Technical Confluences Indicator.
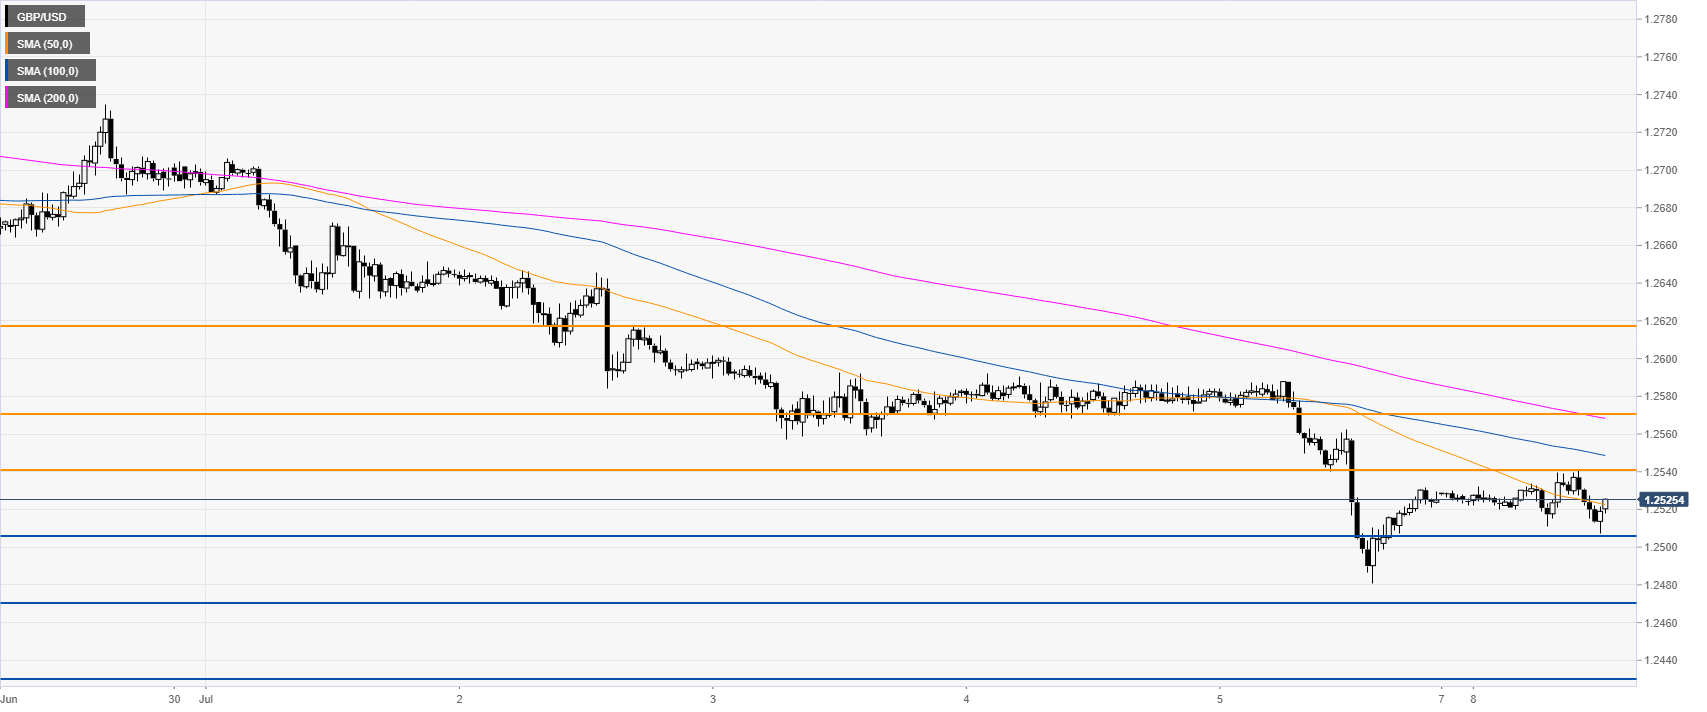
GBP/USD 30-minute chart
GBP/USD is under strong bearish pressure below its main SMAs suggesting bearish momentum in the near term. Immediate resistances are seen at 1.2540, 1.2570 and 1.2617, according to the Technical Confluences Indicator.
Additional key levels
