- USD/CAD is trading above the 1.3100 figure off multi-month lows.
- Investors will scrutinize the FOMC minutes at 18.00 GMT.
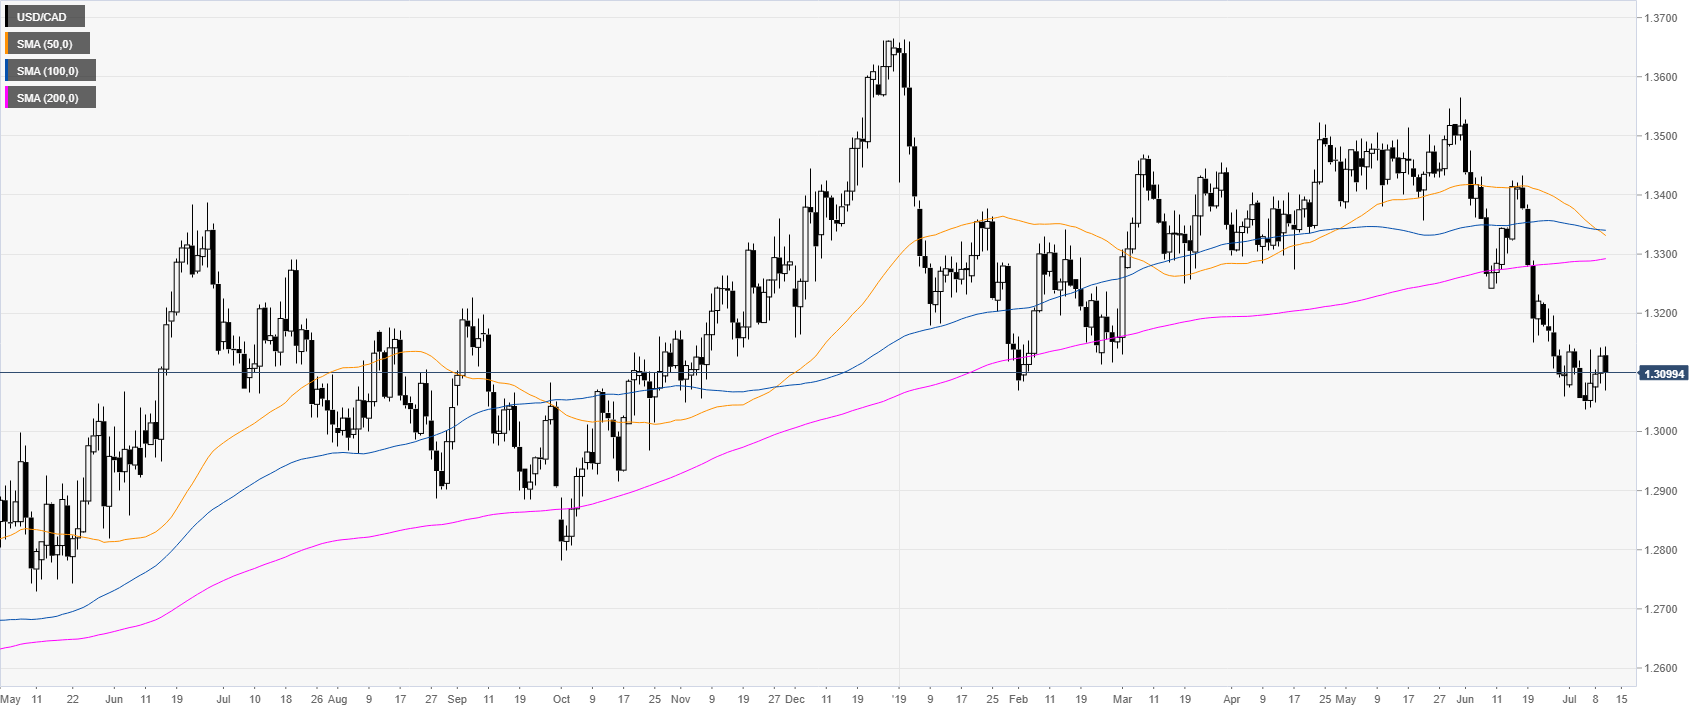
USD/CAD daily chart
USD/CAD is trading above multi-month lows as the market is trading below its main daily simple moving averages (DSMAs).

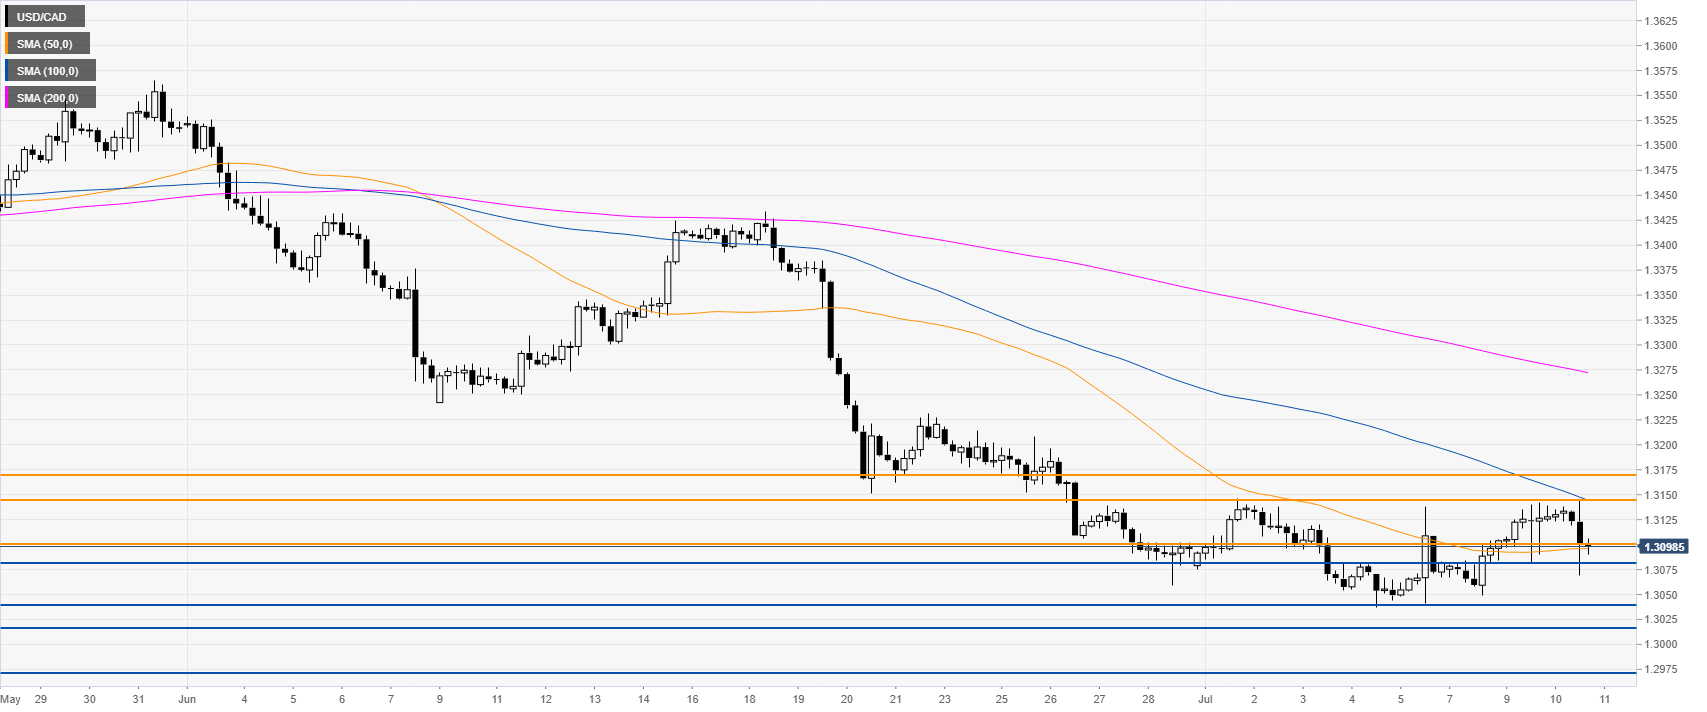
USD/CAD 4-hour chart
The market is trading just below 1.3100 and near the 50 SMA. The level to beat for bears is 1.3080 followed by 1.3040 and 1.3016, according to the Technical Confluences Indicator.
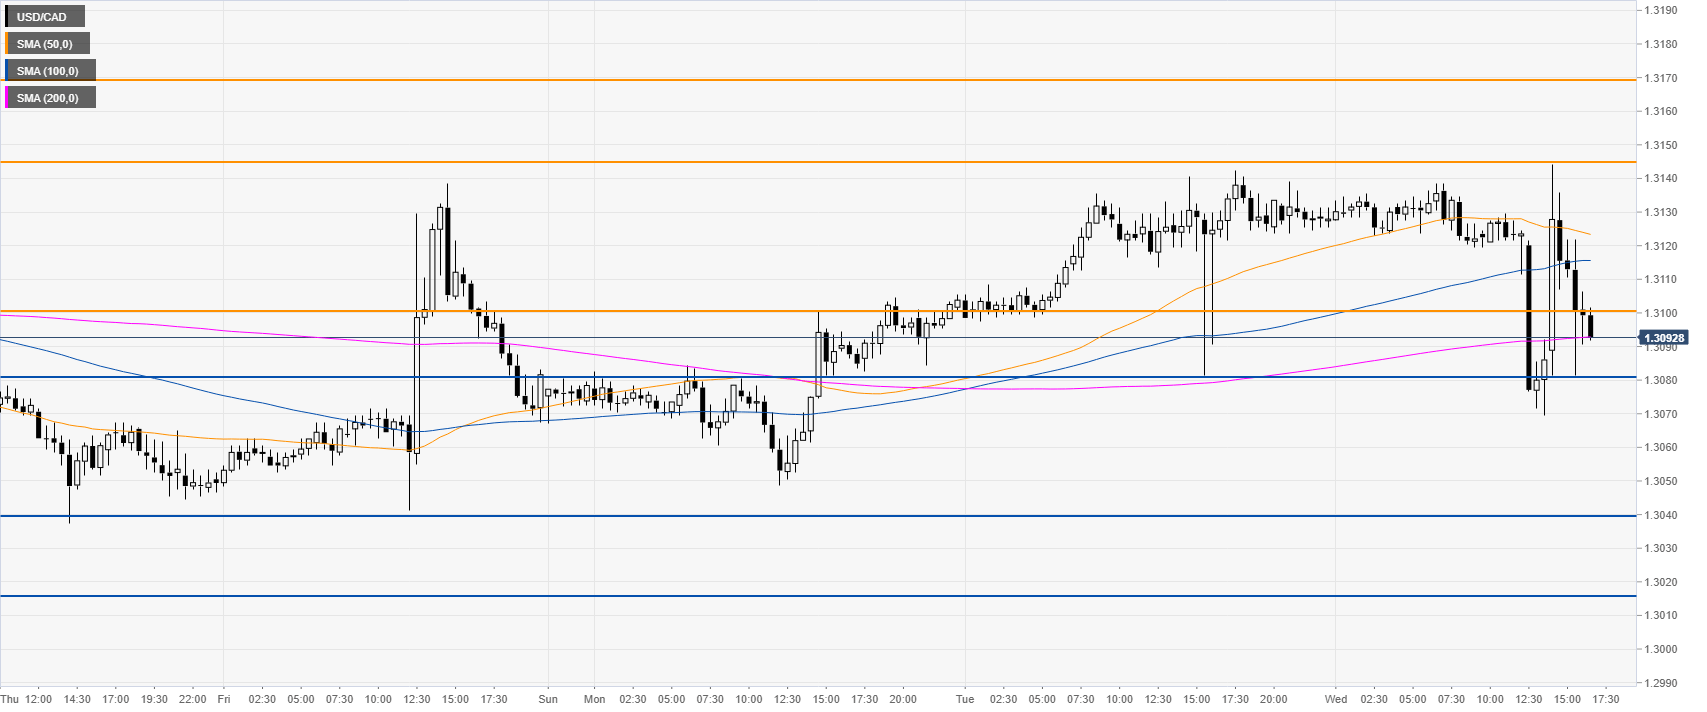
USD/CAD 30-minute chart
The market is having big intraday swings in both directions suggesting a sideways market in the near term. Resistances are seen near 1.3100 and 1.3150, according to the Technical Confluences Indicator.
Additional key levels