- Near-term key trend-line and exponential moving average (EMA) triggers the GBP/USD pair’s pullback.
- 23.6% Fibonacci retracement and 1.2480/77 can please sellers.
- RSI close to the overbought area also signals bearish bias.
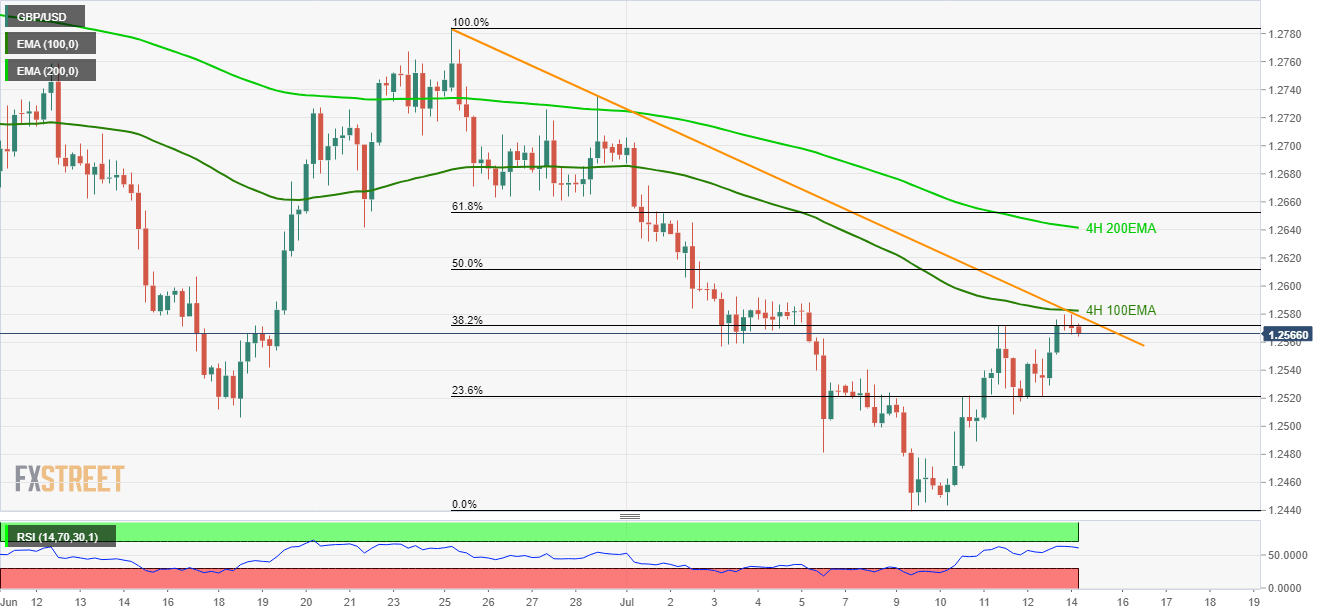
With the key upside barriers limiting the GBP/USD pair’s latest recovery, the quote witnesses a pullback move around 1.2565 during early Monday.
Considering the overbought conditions of 14-bar relative strength index (RSI) prices can extend recent pullback towards 1.2540 ahead of highlighting 23.6% Fibonacci retracement level of late-June to early-July downpour, at 1.2520.
Should there be additional weakness past-1.2520, 1.2480/77 are comprising early-month extremes could question bears targeting the month’s low close to 1.2440.
Alternatively, 1.2579/82 resistance confluence including 100-bar exponential moving average (4H 100EMA) and a 20-day descending trend-line seems the key for buyers.
If prices rally past-1.2582, 1.2590 and 50% Fibonacci retracement around 1.2612 can offer intermediate halts during the pair’s rally aiming 4H 200EMA level of 1.2642.
GBP/USD 4-hour chart
Trend: Pullback expected
