- RSI close to oversold conditions can trigger the GBP/JPY pair’s U-turn from key support-line.
- Break of mid-January low can escalate the upside towards 23.6% Fibonacci retracement.
Bears dominate GBP/JPY momentum as the quote seesaws near six-month lows to 135.07 during the early Asian session on Tuesday.
An upward sloping trend-line connecting September 2017 low to January 2019 bottom, at 134.14 now, becomes key for traders amid nearly oversold conditions of 14-bar relative strength index (RSI).
With this, pair’s U-turn to mid-January lows surrounding 137.36 can’t be denied. However, an upside break of which seems a tough move that holds the key to 23.6% Fibonacci retracement level of 2015 swing highs to 2016 swing lows around 140.45.
Meanwhile, a downside break of 134.14 can further strengthen bears towards targeting the current year low close to 131.80 with 133.50 likely being an intermediate halt.
GBP/JPY weekly chart
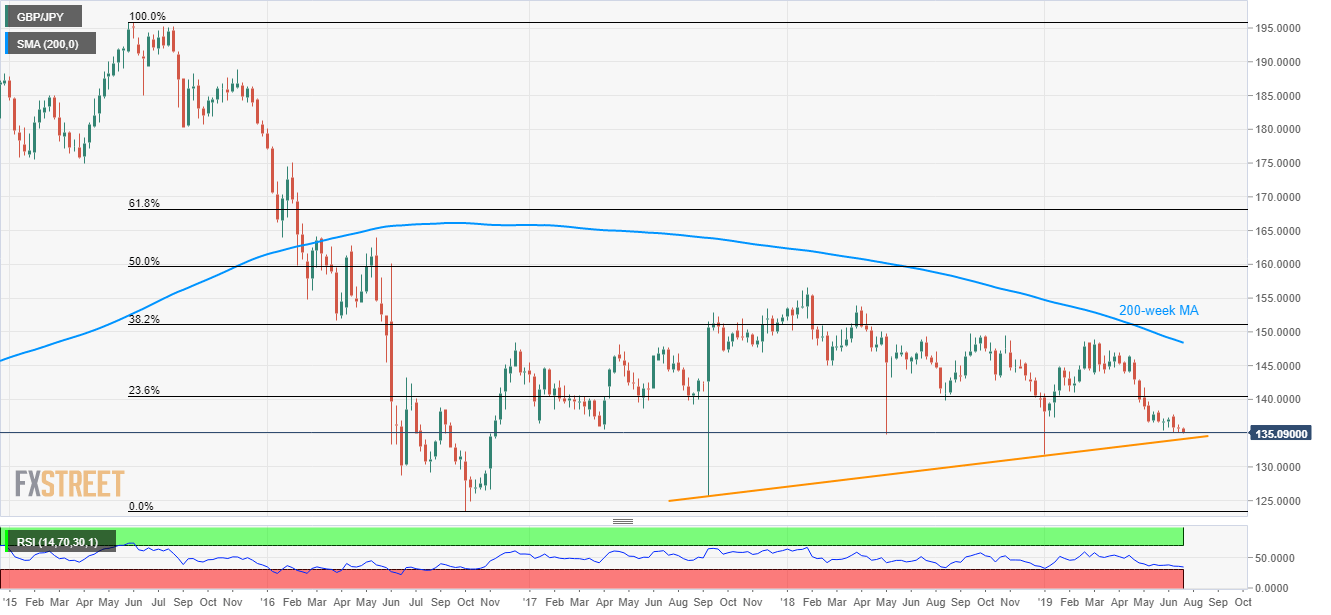
Trend: Pullback expected
