- Short-term key HMAs limit the GBP/JPY pair’s downside whereas immediate descending trend-line caps the rise.
- Technical indicators signal exhaustion of selling pressure.
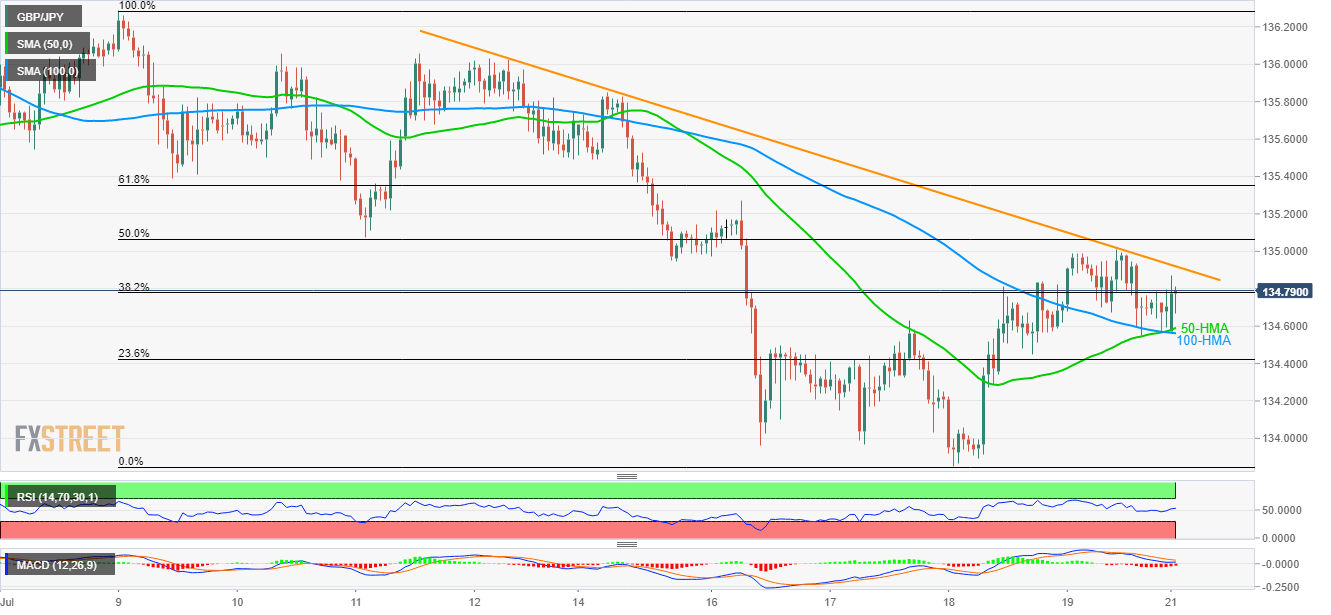
Having bounced from 50/100 HMA, GBP/JPY takes the bids to 134.80 during the early Asian trading session on Monday.
While recent U-turn from 50 and 100-hour moving averages (HMAs) favor the pair’s advances, a downward sloping trend-line since July 12 restricts the rise.
However, 14-bar relative strength index (RSI) and 12-bar moving average convergence and divergence (MACD) signal exhaustion of selling pressure.
As a result, the quote’s run-up towards 50% Fibonacci retracement level of 135.07 and a follow-on rally to 135.50 on the successful break of 134.92 resistance-line can’t be denied.
Alternatively, pair’s decline below 134.59/56 support confluence can recall 134.00 and 133.85 on the chart.
GBP/JPY hourly chart
Trend: Bullish
