- 21-day EMA holds the key to USD/CNH run-up towards 23.6% Fibonacci retracement.
- 50-day EMA acts as immediate support amid recent lower-high formation.
USD/CNH takes one more U-turn from the 21-day exponential moving average (EMA) as it trades near 6.8800 during early Monday.
The pair is now expected to revisit 50-day EMA support, at 6.8741 now, considering latest lower high formation, a break of which can further fetch the quote towards 38.2% Fibonacci retracement of April – June upside, at 6.8533.
Additionally, the 100-day EMA level of 6.8485 could confine the pair’s extra weakness.
In a case where prices rally beyond 21-day EMA level of 6.8830, 23.6% Fibonacci retracement level of 6.8950 and 6.9000 round-figure can please buyers ahead of pleasing them with mid-June low surrounding 6.9170.
USD/CNH daily chart
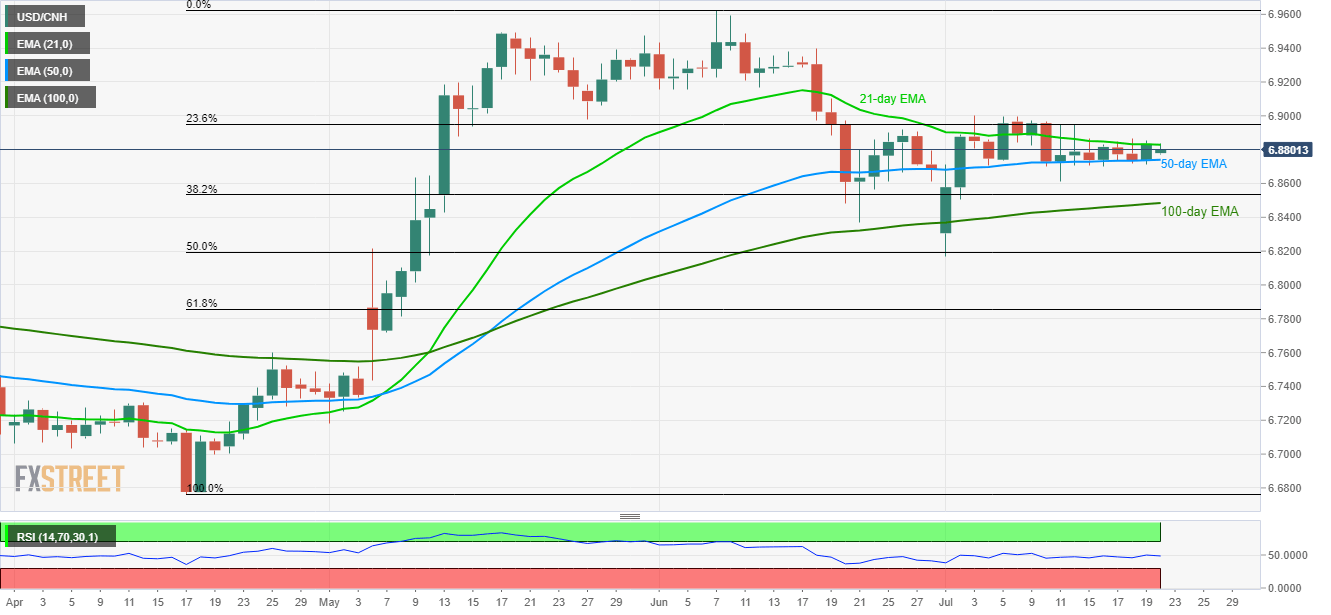
Trend: Pullback expected
