- 50-DMA, 9-week old descending trend-line questions the USD/INR pair’s latest recovery.
- 68.25/30 continues to be the key support.
The USD/INR pair’s recovery from multi-month lows struggles to find the traction as it trades beneath crucial resistance-confluence, near 69.00, heading into Europe open on Monday.
The 50-day moving average (50-DMA) and more than 2-month old descending trend-line question the buyers around 69.30 with gradually rising 14-day relative strength index (RSI).
Should prices rise past-69.30, 23.6% Fibonacci retracement of October 2018 to July 2019 downpour around 69.85 and 70.00 round-figure could flash on bulls’ screen.
Alternatively, 68.60 and 68.25/30 holds the key to the pair’s fresh south-run towards sub-68.00 area.
USD/INR daily chart
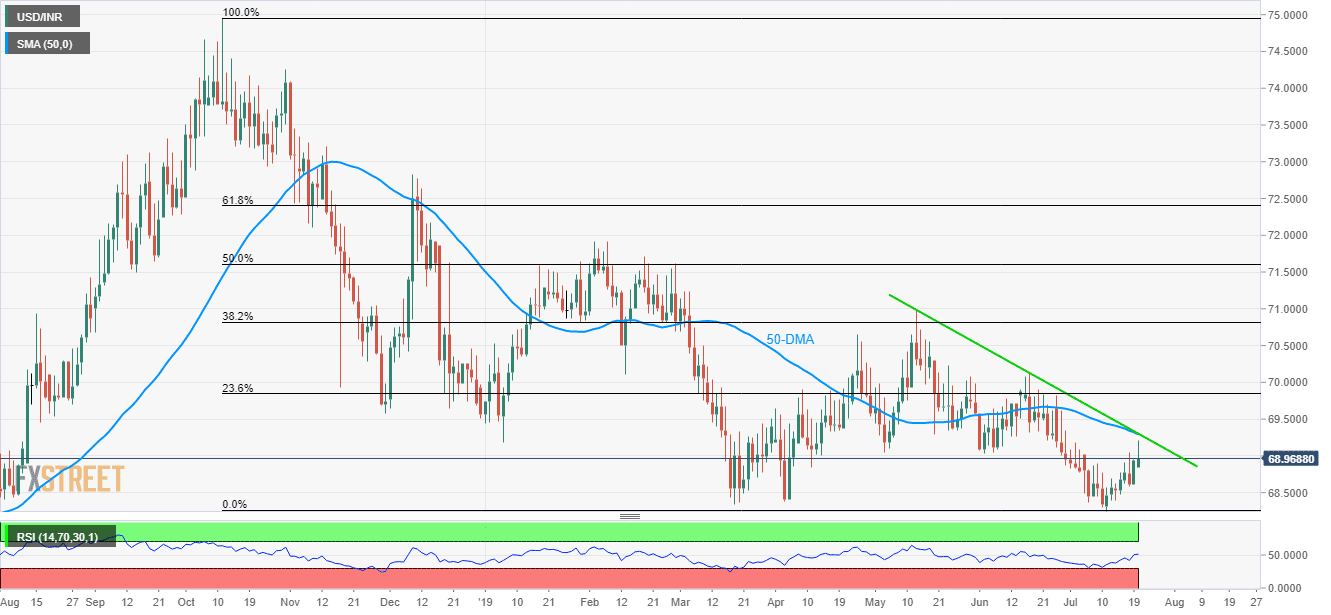
Trend: Pullback expected
