- Resistance-line of a short-term failing channel, 4H 200MA limit the USD/IDR pair’s latest recovery.
- 13,885 and channel’s support-line could please sellers during fresh entry.
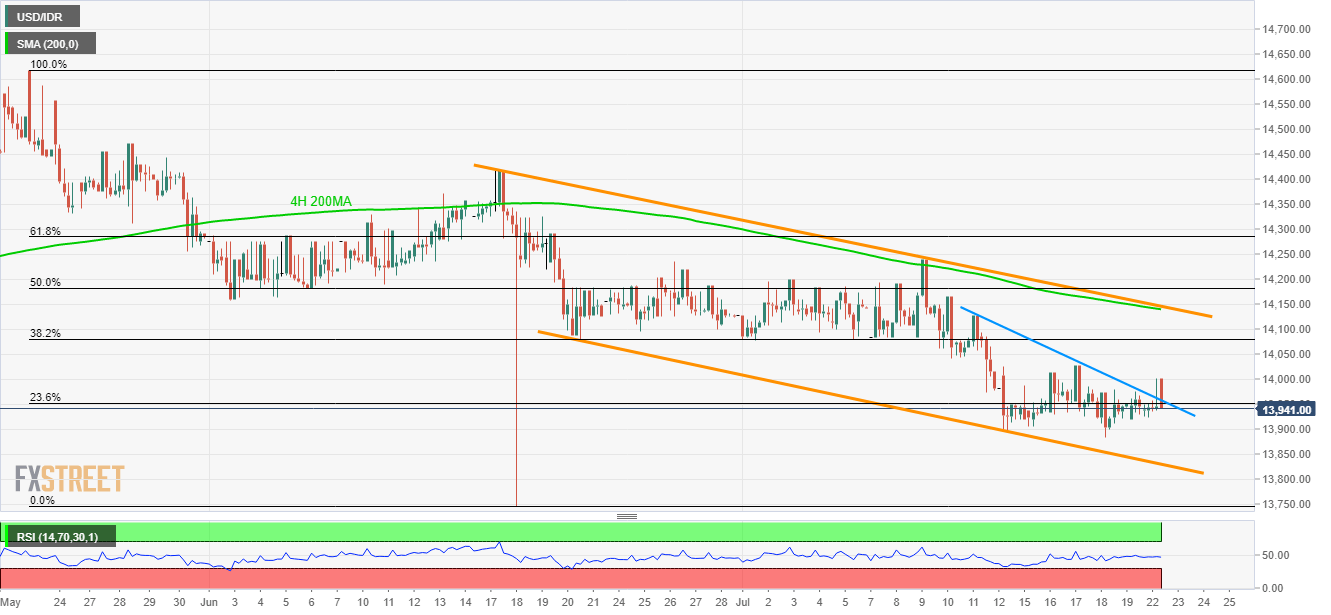
Having breached immediate resistance-line, USD/IDR takes the bids to 13,941 during early Tuesday.
Break of short-term upside barrier and absence of oversold technical indicators favors the pair’s further recovery towards last week’s high around $14,030 and 38.2% Fibonacci retracement level of 14,080.
However, 200-bar moving average (4H 200MA) and upper-line of the channel can limit the quote’s further advances around 14,140/45.
In a case buyers refrain from respecting 14,145, 61.8% Fibonacci retracement level of 14,285 and June 18 high around 14,420 will become their targets.
On the contrary, 13,885 and channel-support close to 13,830 hold the keys to the quote’s fresh drop towards 13,750.
USD/IDR 4-hour chart
Trend: Pullback expected
