- 23.6% Fibonacci retracement of multi-year old downpour limits the GBP/USD pair’s immediate upside.
- 2.5 month long descending trend-line becomes sellers’ favorite tool.
- Multiple halts before meeting the 1.2300 round-figure.
10-week old descending trend-line keeps GBP/USD upside confined as the quote declines to 1.2455 ahead of the UK open on Tuesday.
While current year low near 1.2382 offers immediate support, March – April 2017 raise 1.2365 and 1.2335/30 as following levels to watch during further declines.
In case prices keep trading southwards below 1.2330, 1.2300 is likely an intermediate stop before watching over March 2017 bottom surrounding 1.2110.
Alternatively, 23.6% Fibonacci retracement level of 1.2570, followed by short-term falling resistance-line at 1.2580, can continue being tough upside barriers for the buyers to conquers.
If bulls manage to cross 1.2580, June high close to 1.2685 could be next on their watchlist.
GBP/USD weekly chart
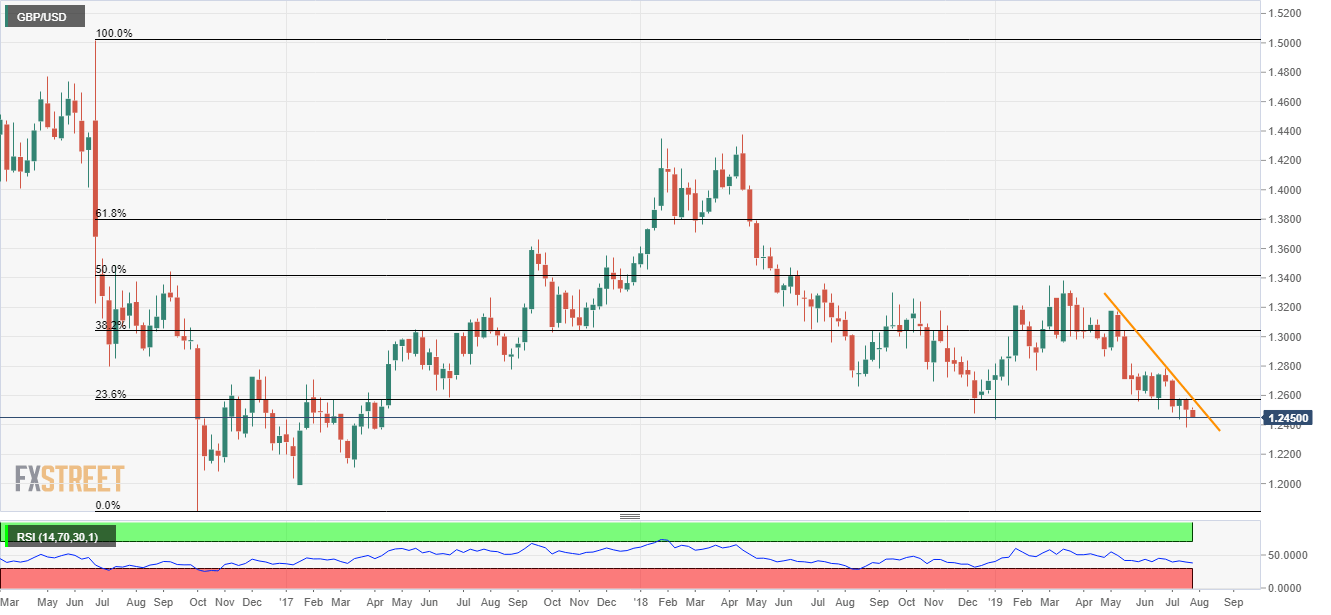
Trend: Bearish
