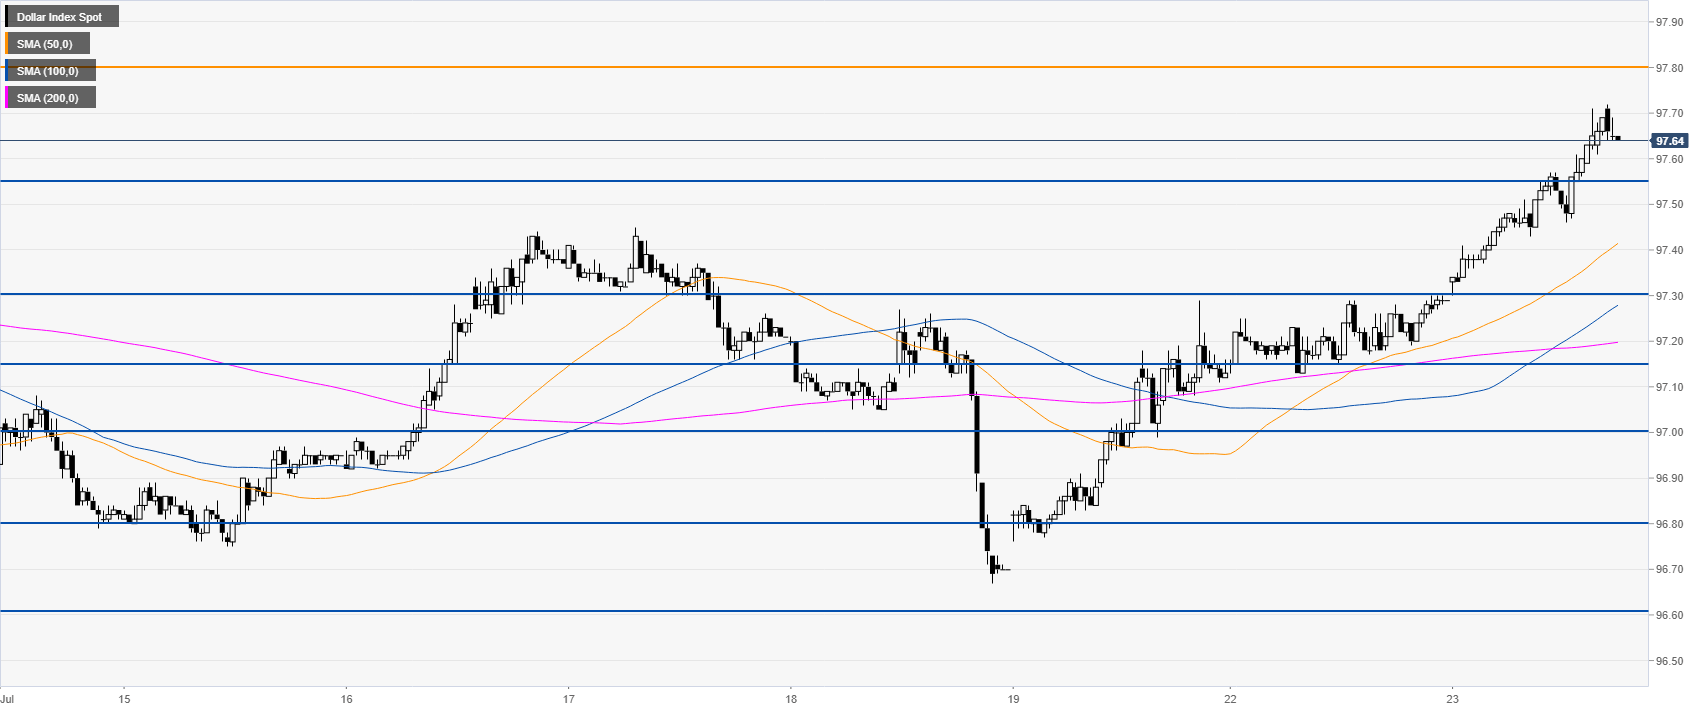
- DXY leaped this Tuesday as the bulls broke above 97.55 resistance.
- The level to beat for buyers are seen at 97.80 and 98.37.
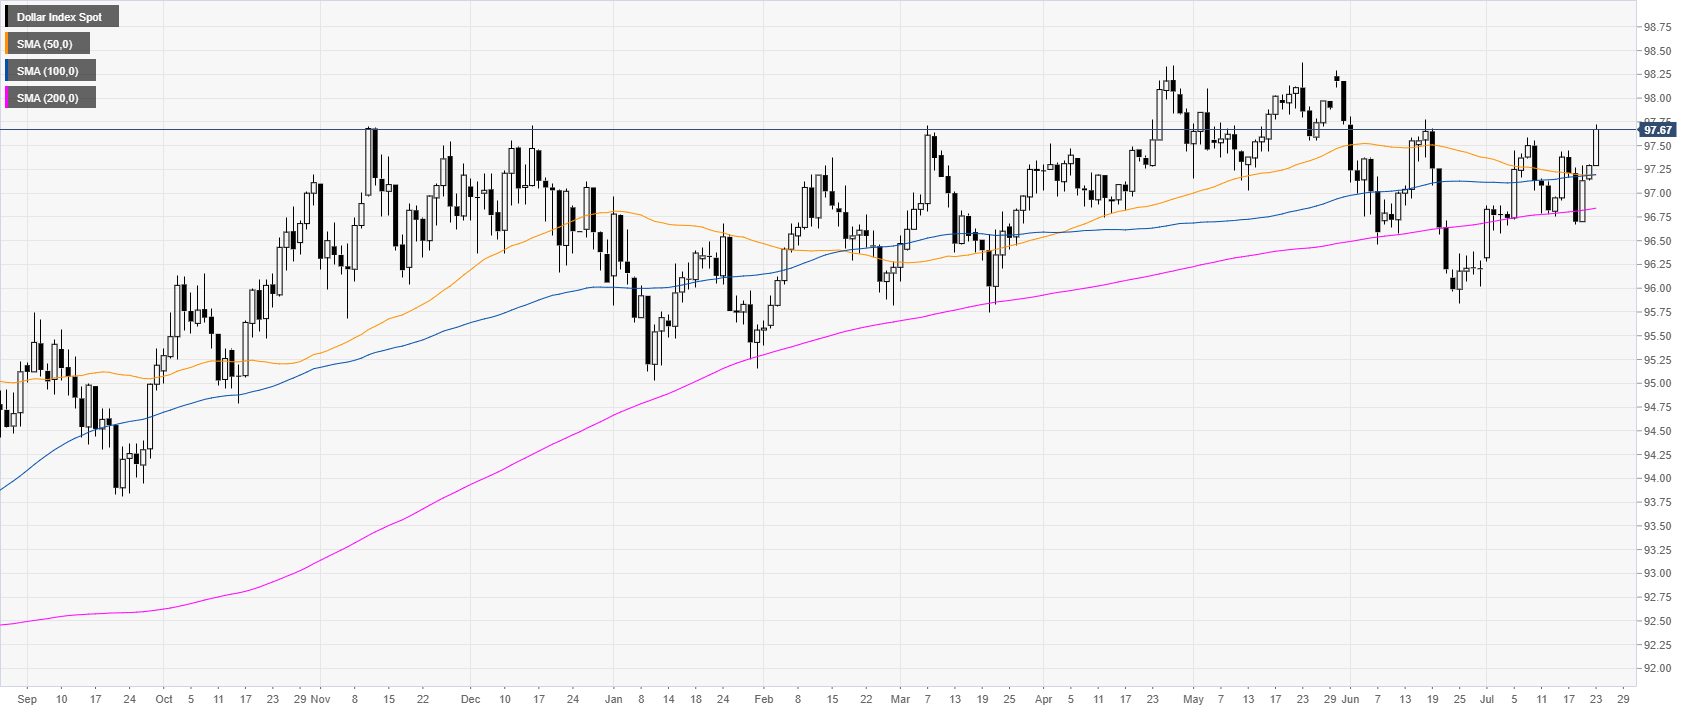
DXY daily chart
The US Dollar Index (DXY) is trading in a bull trend above its main daily simple moving averages (DSMAs). The index is breaking to fresh July highs.
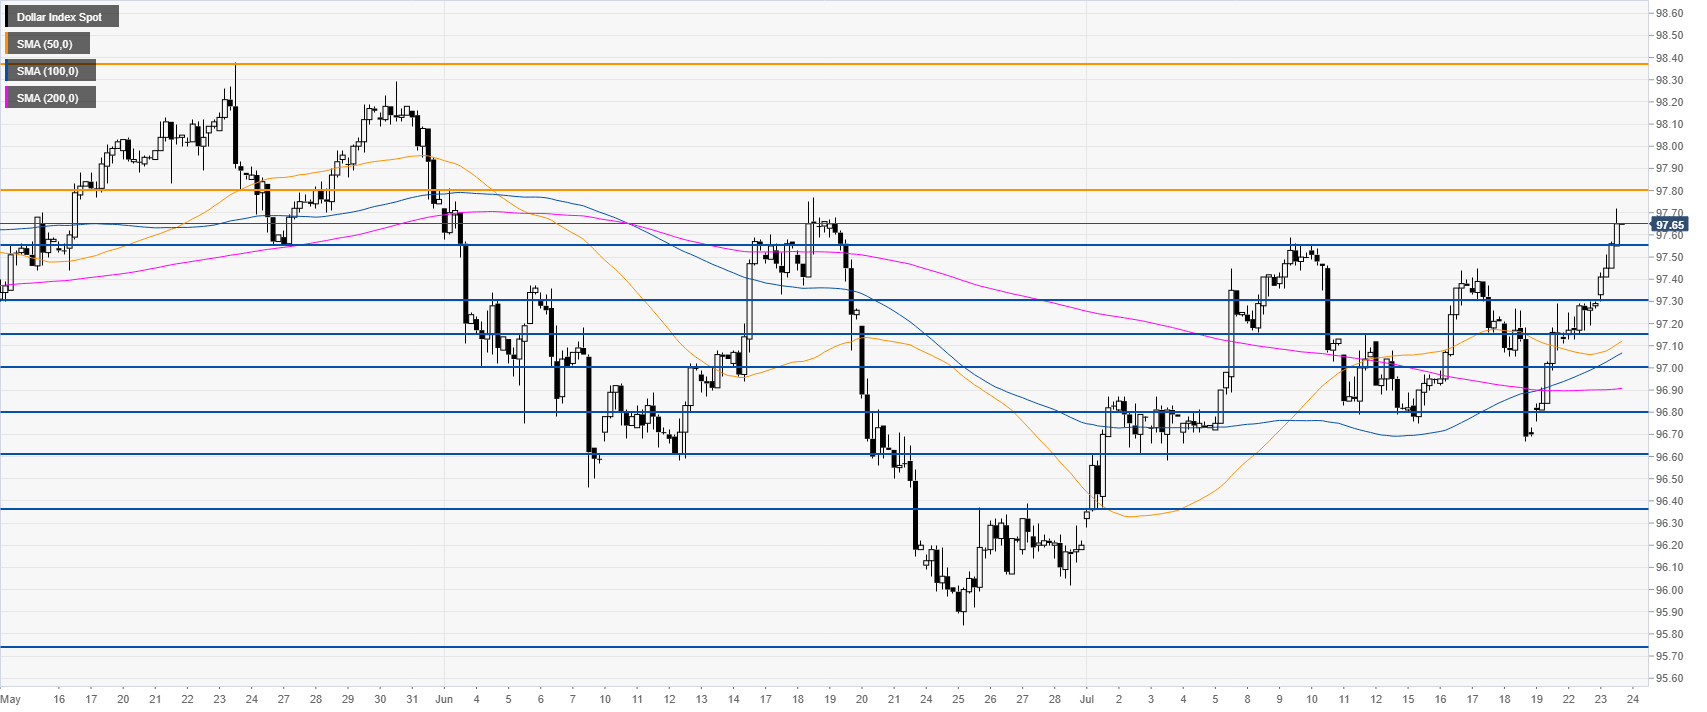
DXY 4-hour chart
DXY is nearing 97.80 resistance level as it is trading above its main SMAs. The 97.80 and 98.37 resistances are likely the next targets on the way up.
DXY 30-minute chart
The buck is trading above the main SMAs suggesting bullish momentum in the near term. Immediate support is seen at the 97.55 and 97.30 levels.

Additional key levels