- GBP/USD is under pressure below the 1.2478 resistance level.
- The level to beat for bears are at 1.2433 and 1.2388, according to the Technical Confluences Indicator.
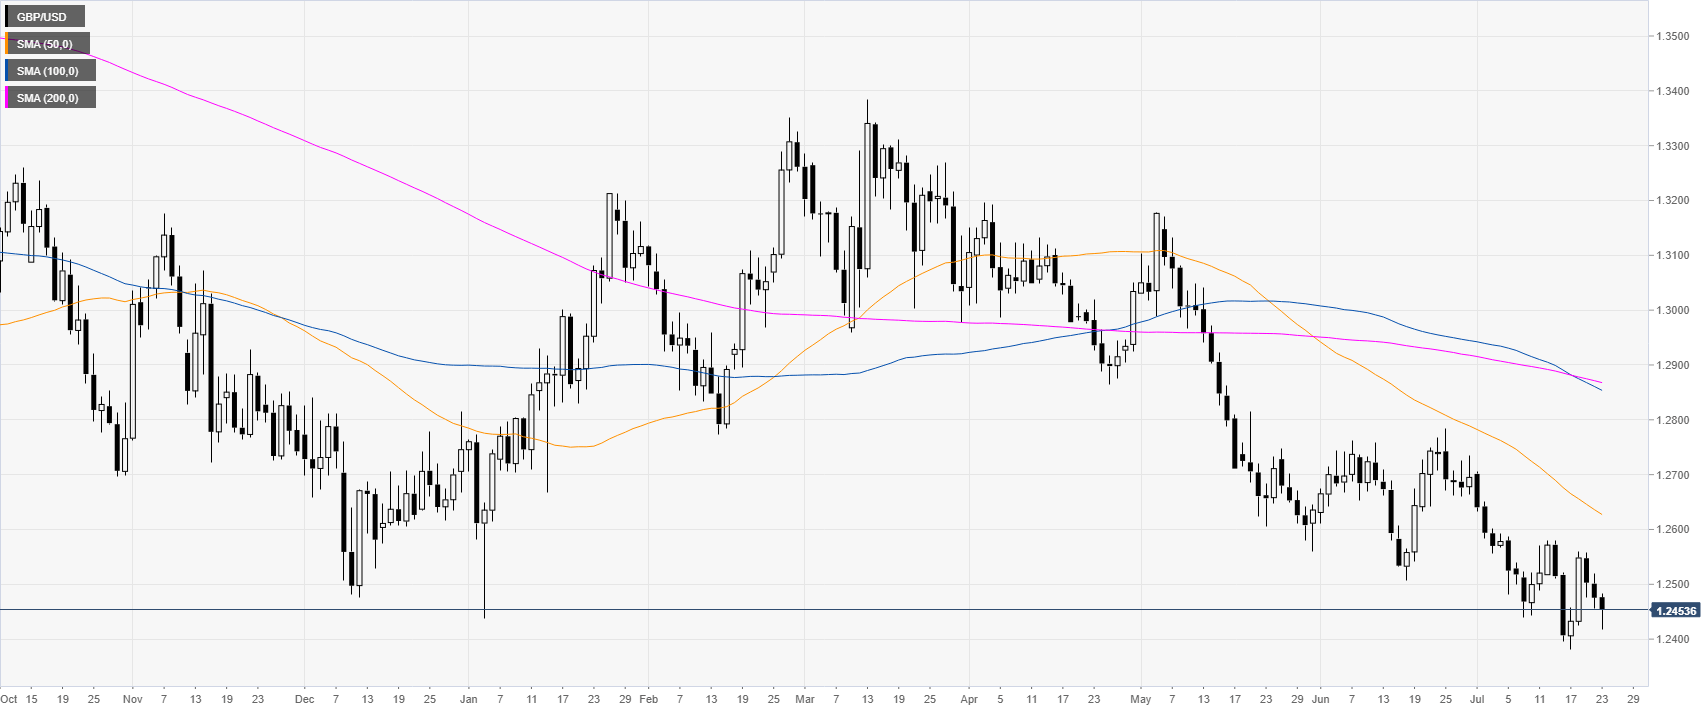
GBP/USD daily chart
Cable is trading in a bear trend below its main daily simple moving averages (DSMAs). The market is currently consolidation the recent losses near the 1.2450 level.

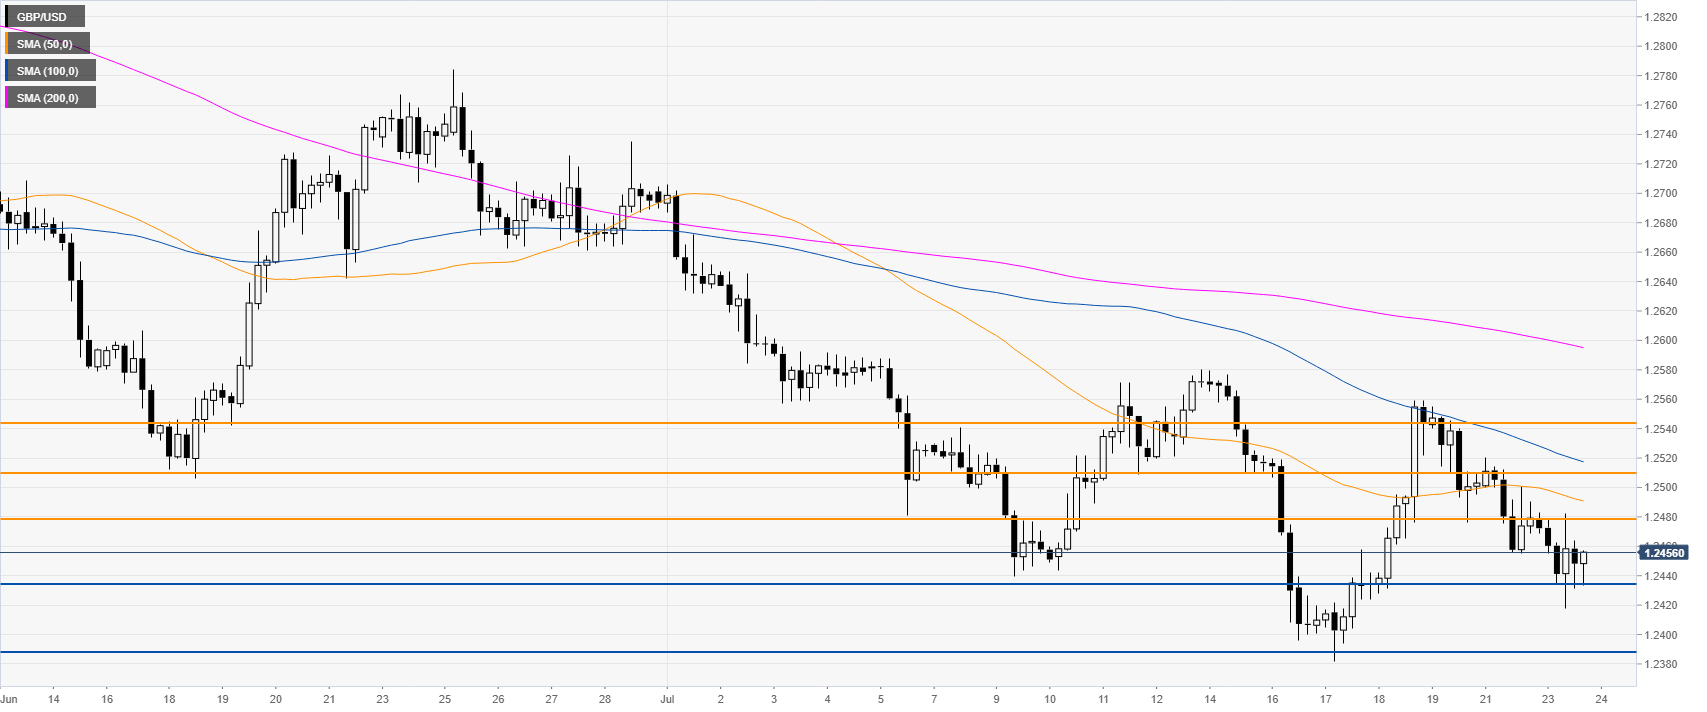
GBP/USD 4-hour chart
Cable is trading below the 1.2478 resistance level and the main SMAs. Sellers want a daily close below 1.2433 support to travel south to the 1.2388 level, according to the Technical Confluences Indicator.
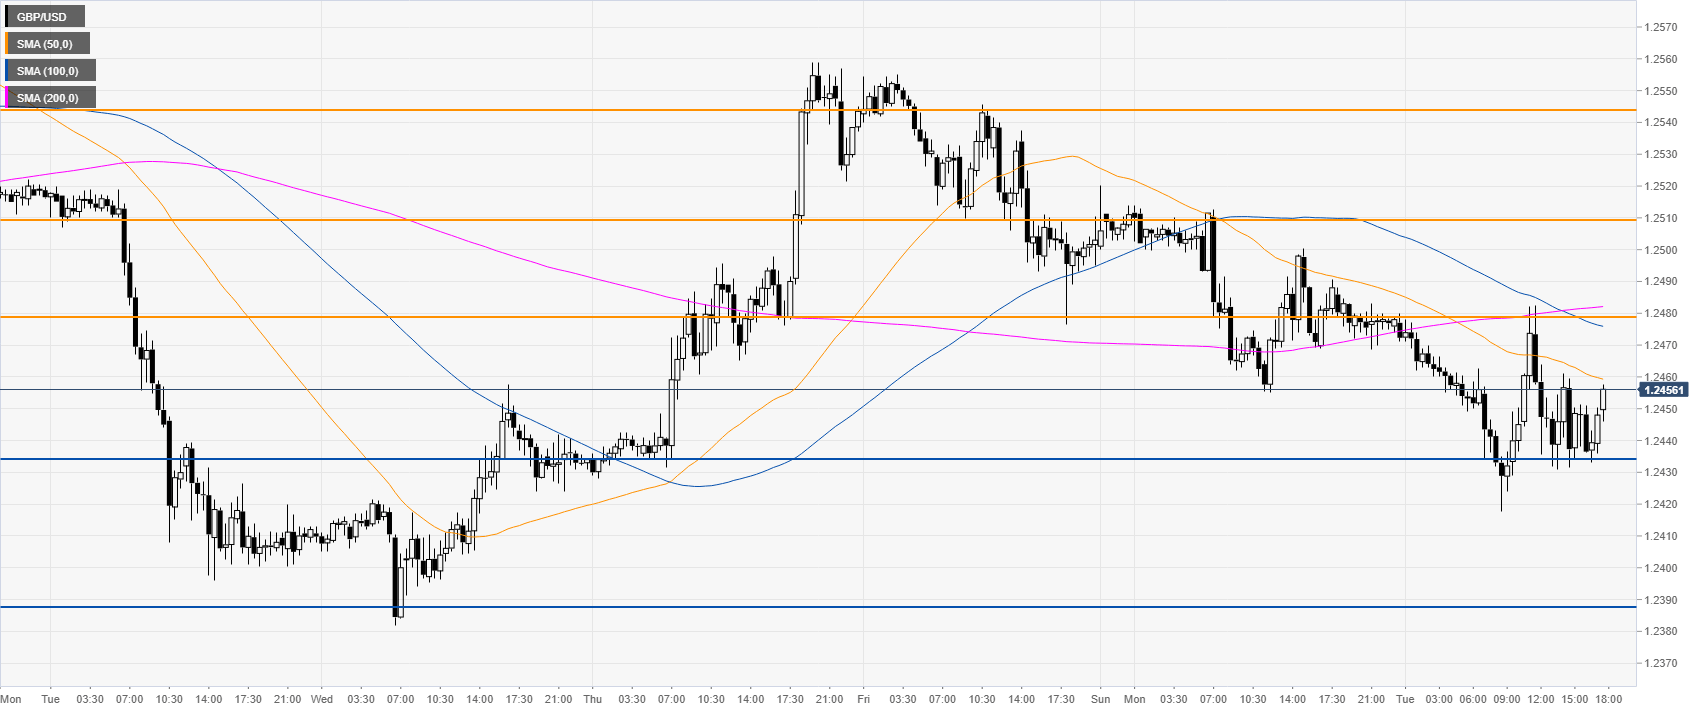
GBP/USD 30-minute chart
GBP/USD is trading below the main SMAs suggesting bearish momentum in the near term. Immediate resistances are seen at 1.2478 and 1.2543.
Additional key levels