- The pullback from 100-DMA, decline below 23.6% Fibonacci retracement portrays USD/INR weakness.
- 21-DMA and 9-day old support-line restrict immediate downside.
Not only failure to cross 100-day moving average (DMA) but decline below 23.6% Fibonacci retracement of February – July decline also portrays USD/INR weakness as it trades near 69.01 ahead of the European open on Wednesday.
21-DMA and an ascending trend-line since July 11, around 68.76/75 seems the key support confluence flashing on the bears’ radar for now.
Should prices dip beneath 68.75, 68.35 and 68.25 can offer intermediate halts to the quote’s slump to 68.00 round-figure.
In a case where the quote clear 100-DMA level of 69.35, 38.2% and 50% Fibonacci retracement levels, around 69.65 and 70.10 respectively, could offer intermediate halts to the rally targeting 200-DMA level of 70.33.
USD/INR daily chart
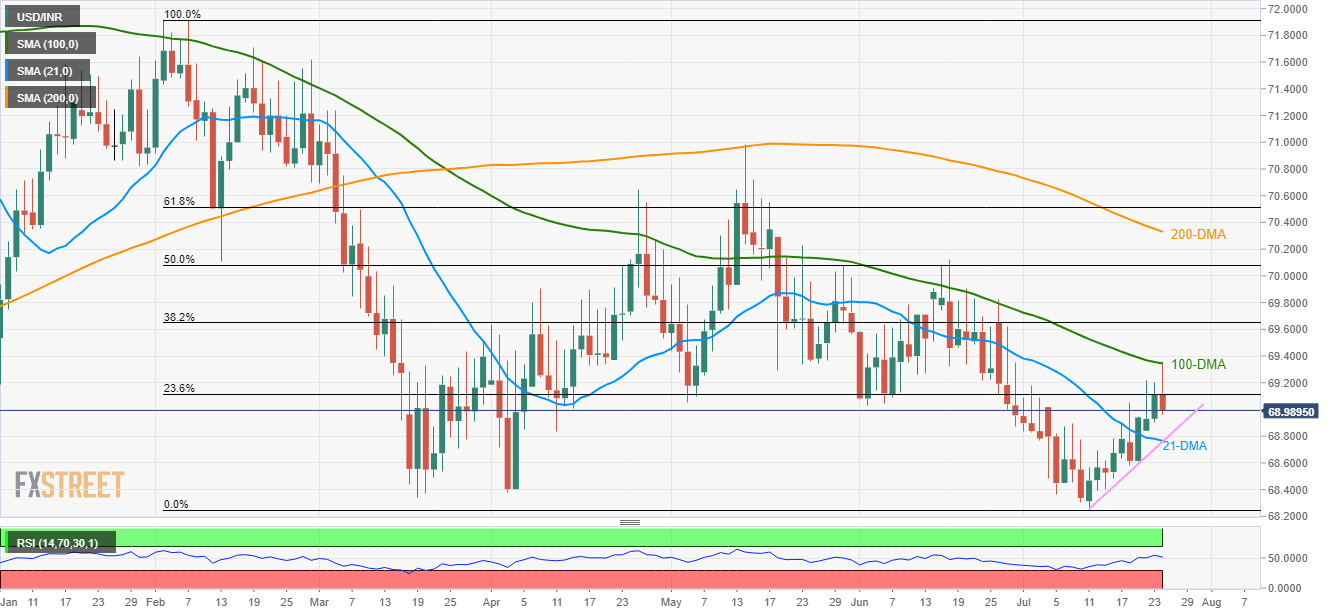
Trend: Bearish
