- GBP/USD is challenging the weekly high as the market found resistance near 1.2510.
- The level to beat for bears are at 1.2478 and 1.2435, according to the Technical Confluences Indicator.
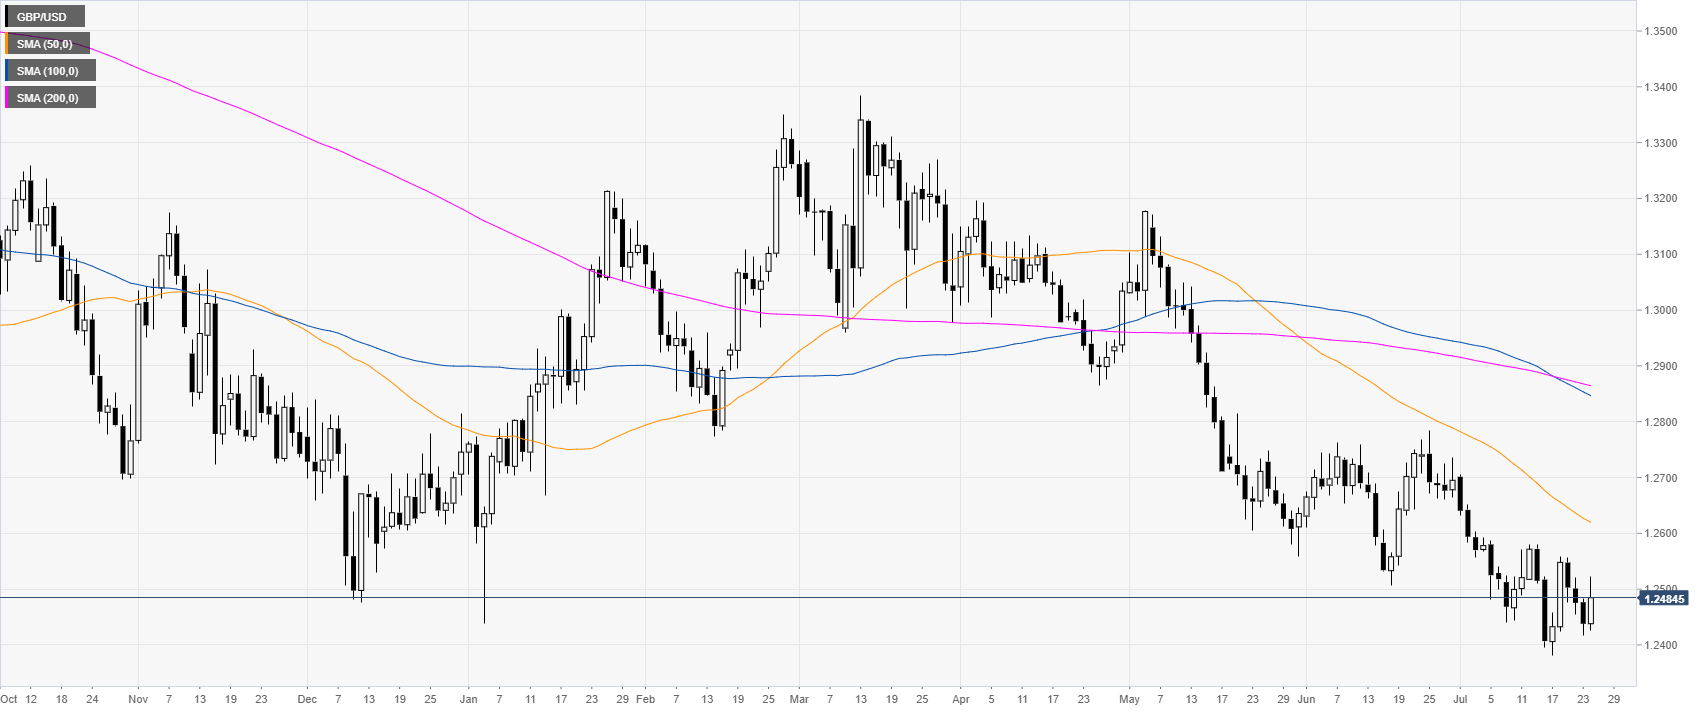
GBP/USD daily chart
Cable is in a bear trend below the main daily simple moving averages (DSMAs). The market made an attempt to retake the 1.2500 figure as bulls tested the weekly high.

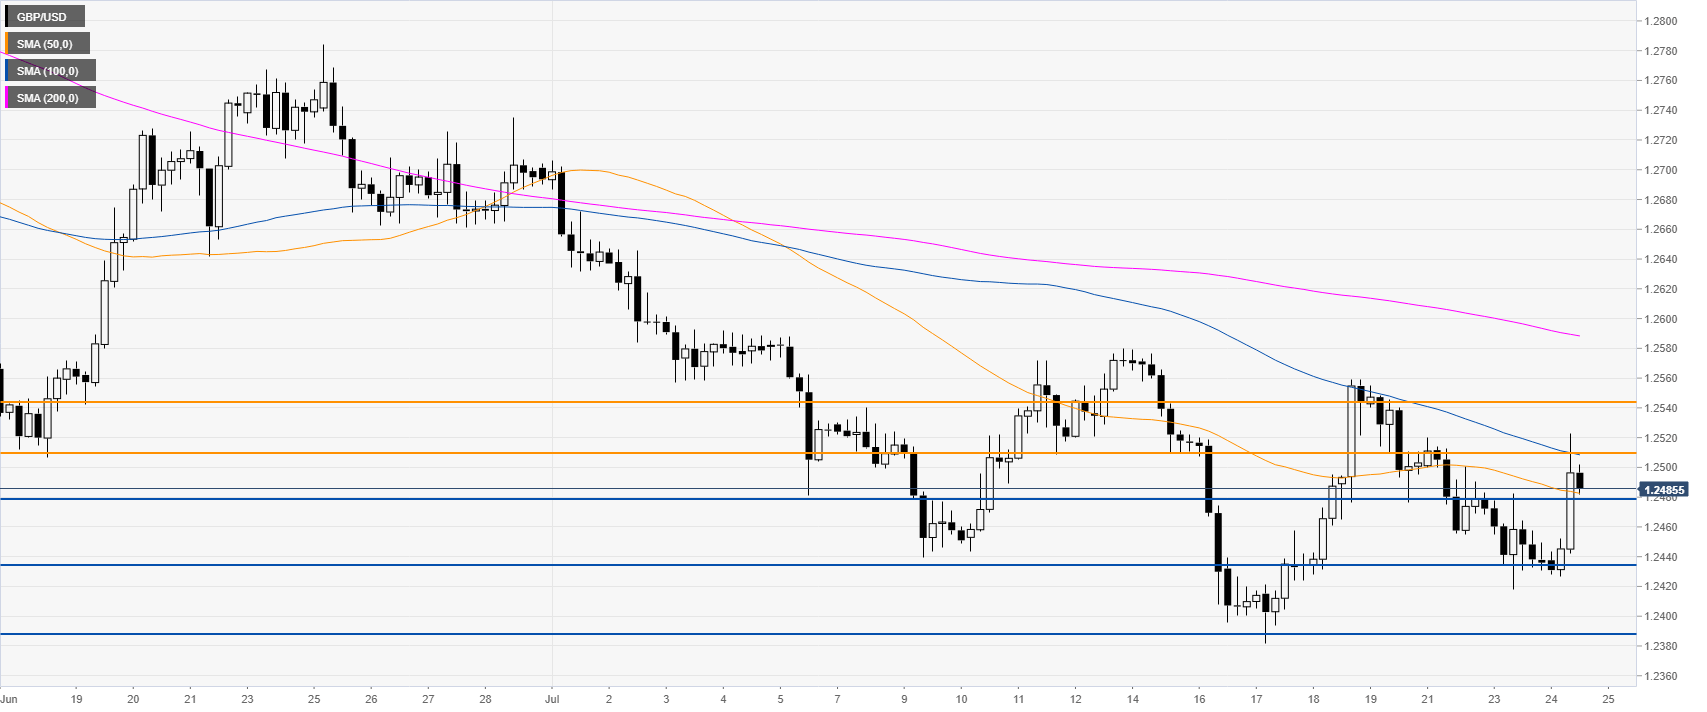
GBP/USD 4-hour chart
Cable is in a bear trend below the main daily simple moving averages (DSMAs). The market made an attempt to retake the 1.2500 figure as bulls tested the weekly high.
GBP/USD 30-minute chart
GBP/USD is challenging 1.2478 support and the 200 SMA. The market foud heavy resiatnce at the 1.2510 level suggesting that the main bear trend is still in effect. Immediate resistances are seen at 1.2510 and 1.2544. 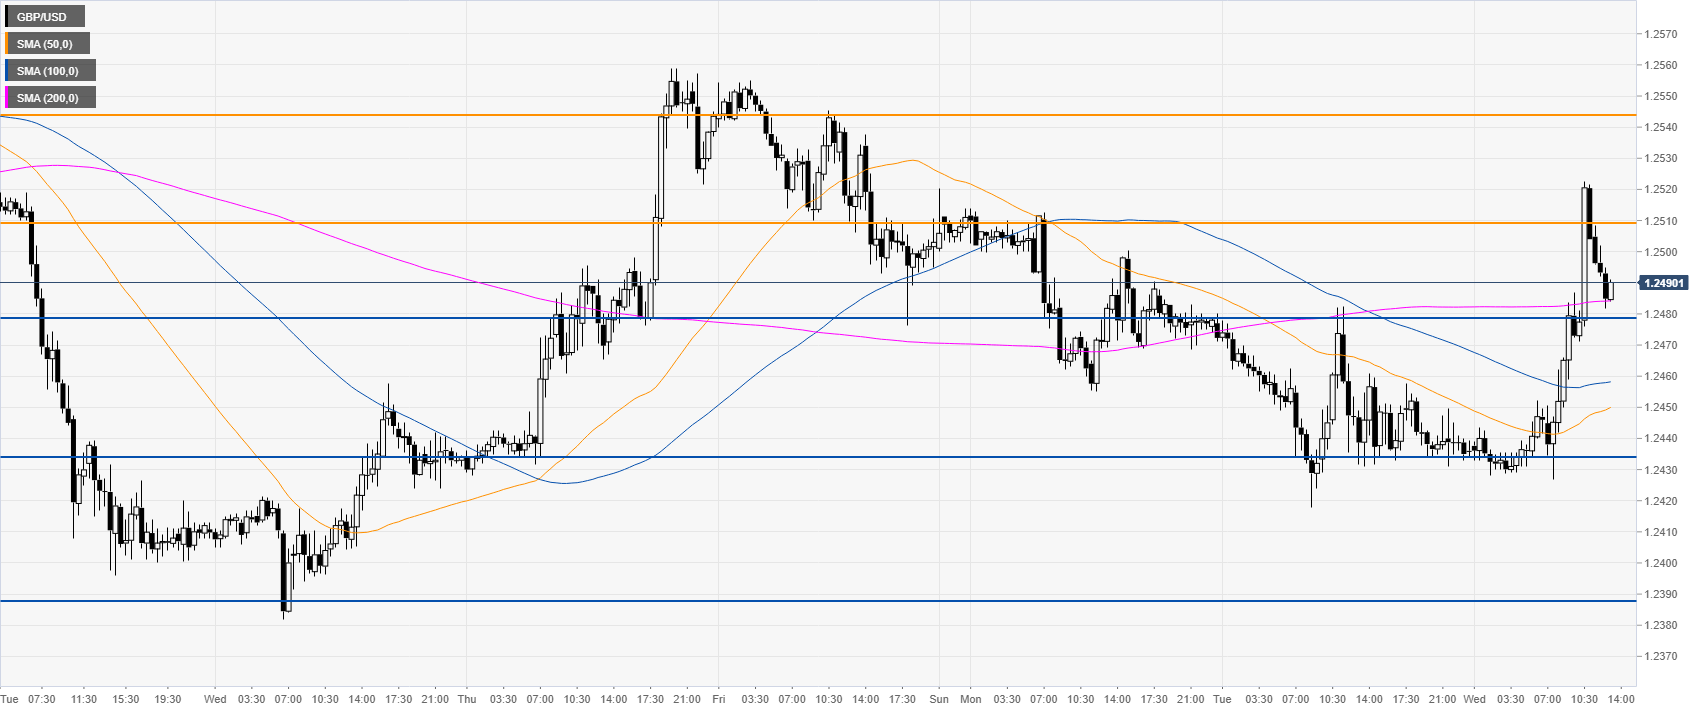
Additional key levels
