- WTI rejects 57.40 resistance as Kuwait and Saudi Arabia plan to resume production.
- The levels to beat for bears are at 55.00 and $54.00 a barrel.
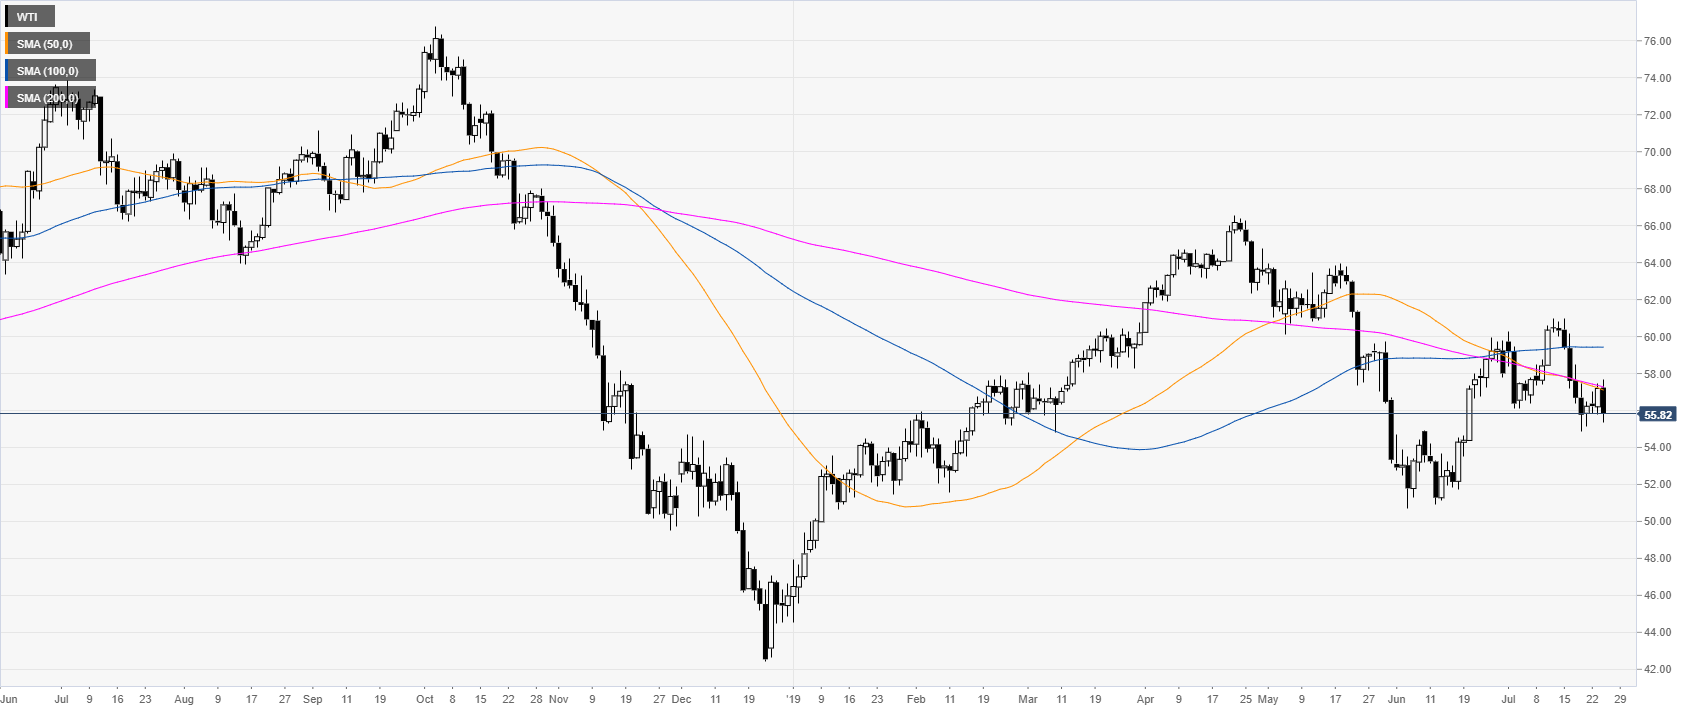
Oil daily chart
WTI (West Texas Intermediate) is trading below its main daily simple moving averages (DSMAs) suggesting a bearish bias. Crude oil falls sharply as Kuwait and Saudi Arabia look to resume production in Neutral Zone.
Oil 4-hour chart
WTI is trading below its main SMAs suggesting bearish momentum in the medium term. Bulls attempted to break above 57.00 and 57.40 resistances but found no price acceptance as the market fell.

Oil 30-minute chart
Oil is trading below 56.00 and its main SMAs. Bears seem to be back and they might try to drive the market to 55.00 and 54.00 support.

Additional key levels
