- GBP/USD extended the decline this Tuesday as the market is trading at 2-year lows.
- GBP/USD is now consolidating the recent selloff above the 1.2100 figure
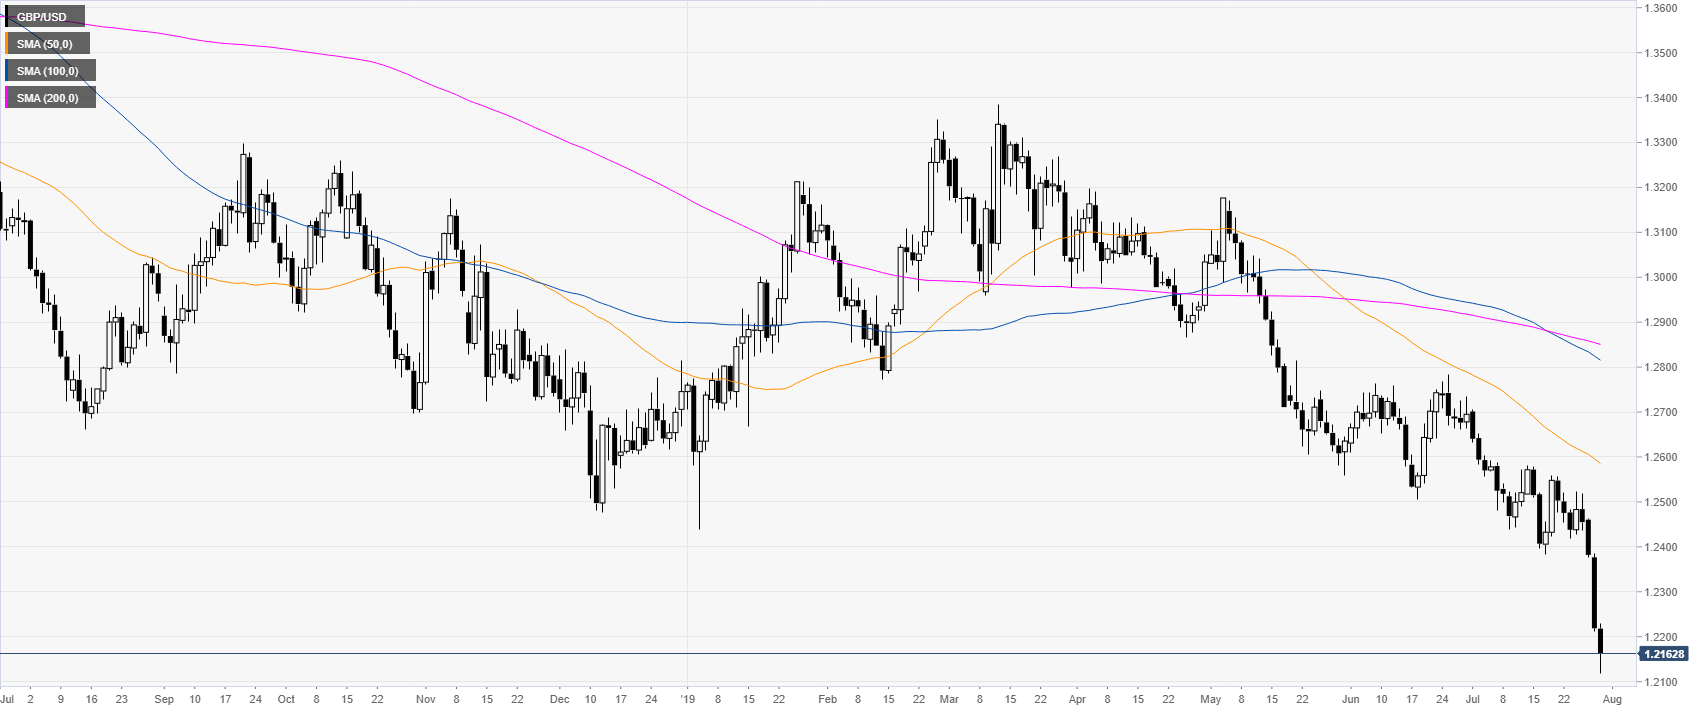
GBP/USD daily chart
Cable is trading near its lowest level since March 2017 as on Monday UK Prime Minister Boris Johnson pushed for a no-deal Brexit.
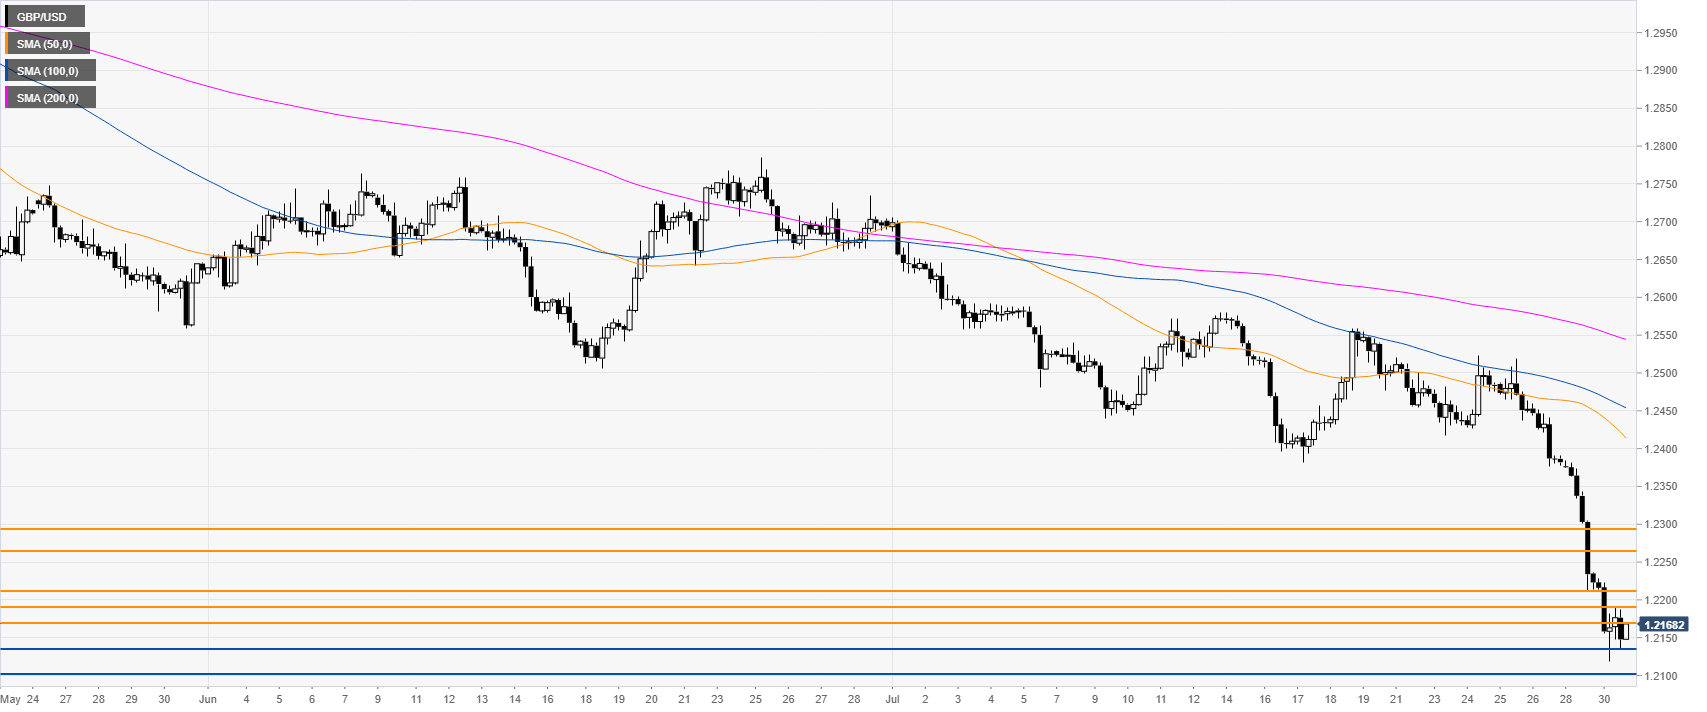
GBP/USD 4-hour chart
GBP/USD is trading below the 1.2165 resistance as the market kept falling this Tuesday. Bears want to reach 1.2133 and 1.2100 on the way down, according to the Technical Confluences Indicator.
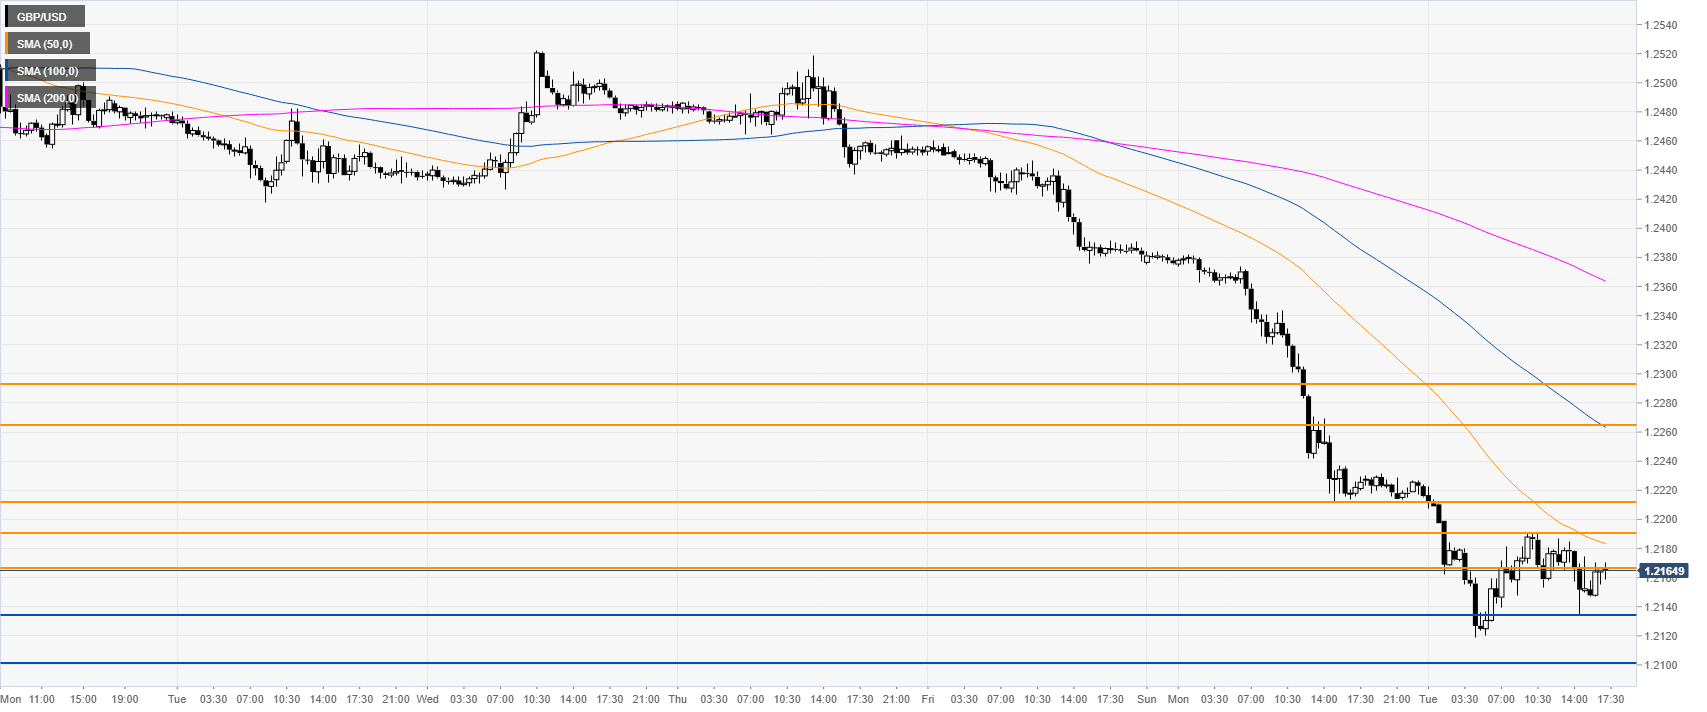
GBP/USD 30-minute chart
Cable is consolidating the recent losses below its main SMAs. A correction up can find immediate resistance at 1.2165, 1.2190, 1.2216, 1.2266 and 1.2291 according to the Technical Confluences Indicator.
Additional key levels
