- A sustained break of 10-month old resistance-line propelled USD/INR to 12-week top.
- 50% Fibonacci retracement questions the rise amid overbought RSI.
- 200-DMA acts as immediate support.
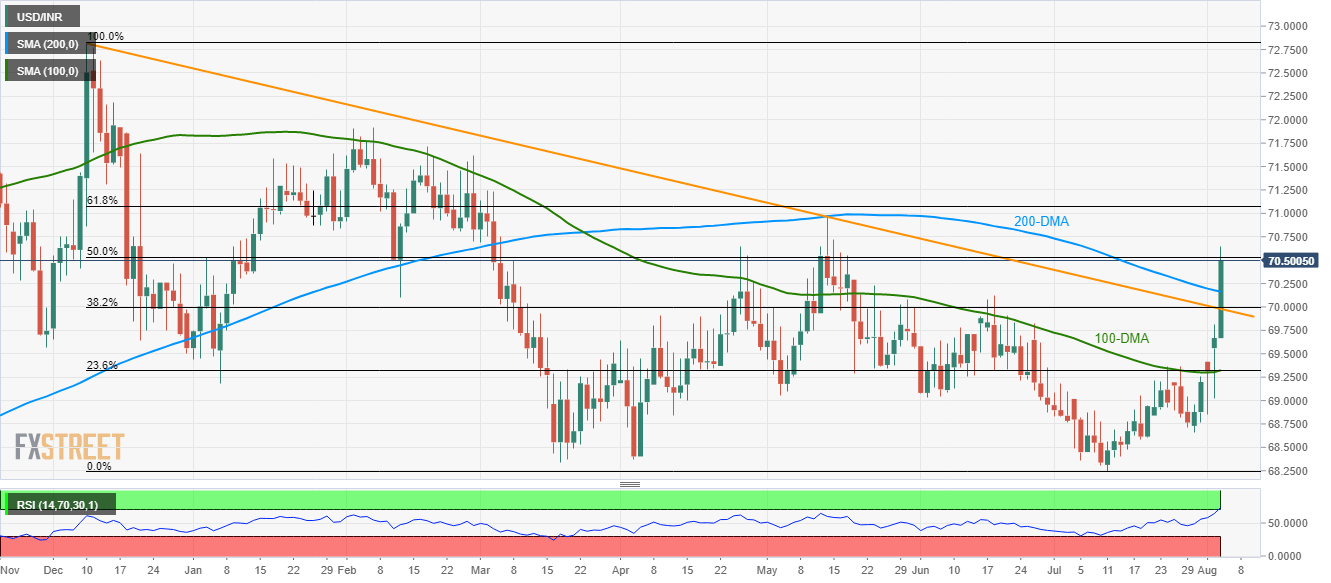
Despite successfully breaking a descending trend-line since October 2018, also clearing 200-DMA, the USD/INR pair presently struggles around 50% Fibonacci retracement of its October 2018 to July 2019 downpour while taking round to 70.5085 ahead of the European open on Monday.
With the 14-day relative strength index (RSI) being in the overbought territory odds are increasing in favor of the quote’s pullback to 200-day moving average (DMA) level of 70.1631, a break of which can drag the prices to 69.98 resistance-turned-support that comprises 38.2% Fibonacci retracement and aforementioned downward sloping trend-line.
If at all settles below 69.98, 100-DMA and 23.6% Fibonacci retracement near 69.30 could lure sellers.
On the upside, sustained trading beyond 70.53, including 50% Fibonacci retracement, could escalate the rise to May month high near 71.00 whereas 61.8% Fibonacci retracement near 71.10 and 71.65 might be buyers’ favorites then after.
USD/INR daily chart
Trend: Pullback expected
