- EUR/USD is approaching 1.1200 as ISM Non-Manufacturing PMI drop to its lowest since August 2016.
- The level to beat for bulls are seen at the 1.1120 and 1.1255 levels.
US: ISM Non-Manufacturing PMI drops to 53.7 in July, lowest since August 2016
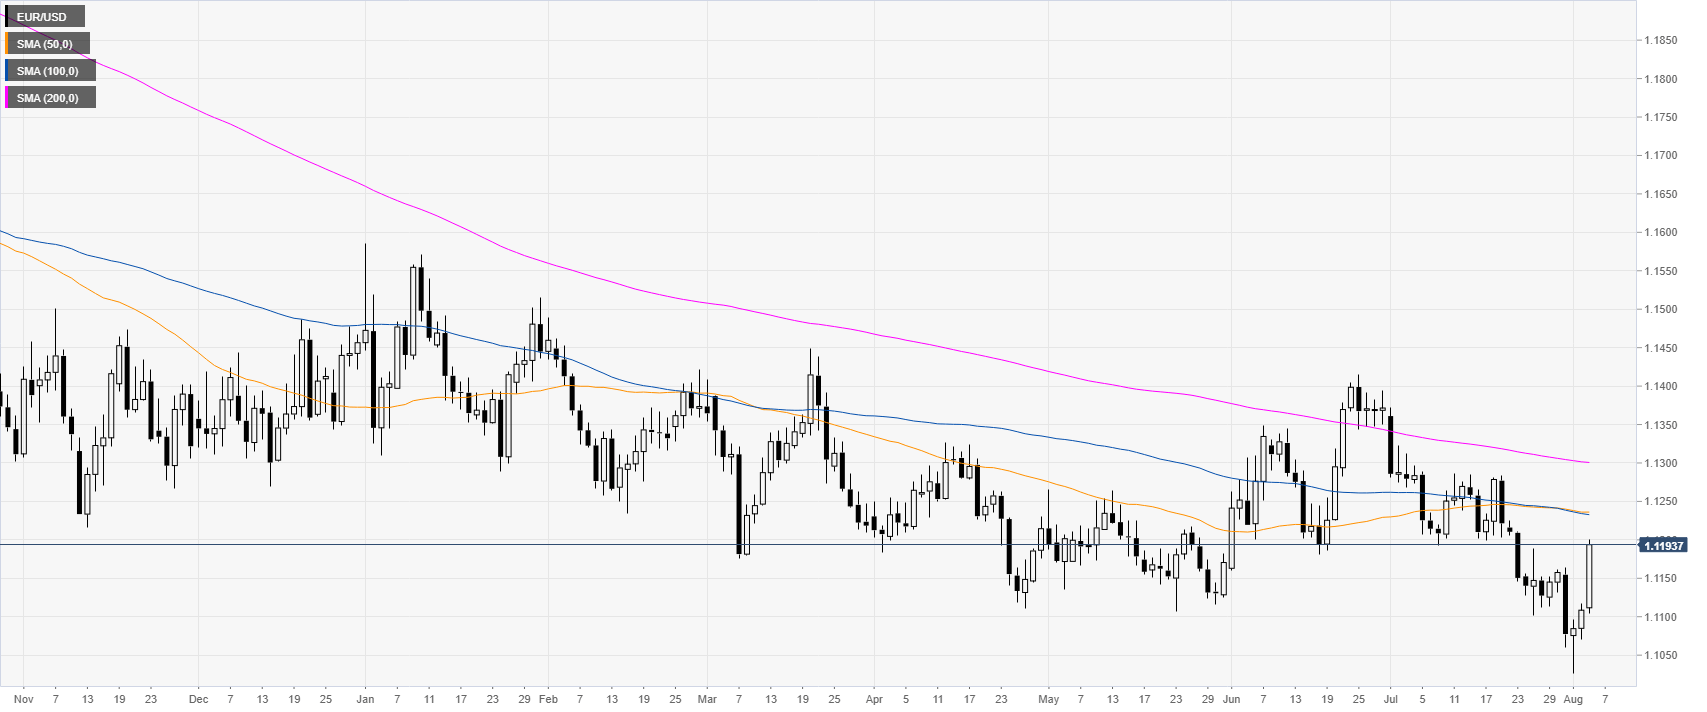
EUR/USD daily chart
EUR/USD is bouncing from the 2019 low as the market is trading in a bear trend below its main daily simple moving averages (DSMAs). The Sino-US trade conflict is weighing heavily on the greenback. Furthermore, US stock markets are falling while investors seek safety in government bonds, sending US bond yields to multi-year lows.
EUR/USD 4-hour chart
EUR/USD broke above 1.1174 resistance as the bulls are relentless. The market is set to continue appreciating towards 1.1120, 1.1255 an potentially to 1.1285 resistance if the bulls gather enough steam, according to the Technical Confluences Indicator.

EUR/USD 30-minute chart
The market is challenging the highest point in height days while above its main SMAs, suggesting bullish momentum in the near term. Support might be located near 1.1174, 1.1135, 1.1121 and 1.1100 levels.

Additional key levels
