- USD/INR takes U-turn from 50% Fibonacci retracement level.
- 200-DMA, medium-term support-line (previous resistance) limit immediate downside.
Having failed to rise past-50% Fibonacci retracement of its downpour from October 2018, USD/INR witnesses pullback to 70.6410 ahead of Tuesday’s Europe market open.
The pair now aims for 70.15/12 support-zone including 200-day moving average (SMA) and Jue month high ahead of visiting the previous resistance-line around 70.00.
In a case prices keep trading southwards past-70.00, 23.6% Fibonacci retracement around 69.80 and late-July high surrounding 69.35/40 can please sellers.
Meanwhile, a sustained break of 50% Fibonacci retracement, at 71.58, can escalate the pair’s latest rise towards February month highs near 71.92 and then to 61.8% Fibonacci retracement near 72.38.
USD/INR daily chart
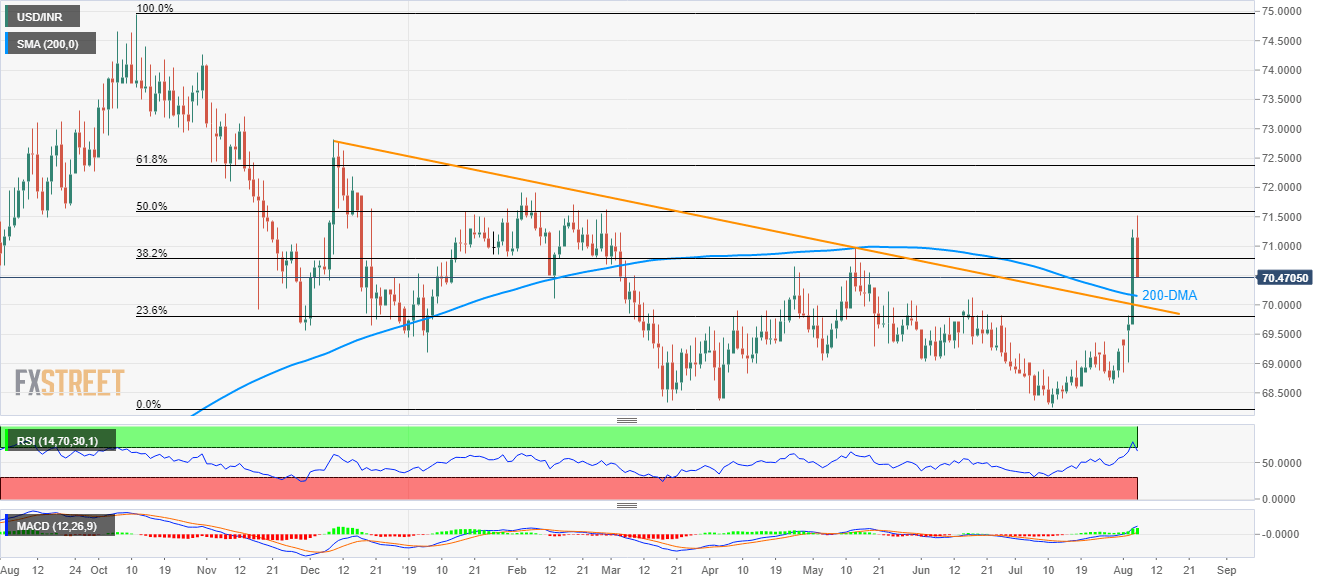
Trend: Pullback expected
