Home US Dollar Index Technical Analysis: The multi-month support line at 97.11 should hold the downside
FXStreet News

US Dollar Index Technical Analysis: The multi-month support line at 97.11 should hold the downside

  • DXY managed to rebound from recent lows in the 97.20 region following a sharp rejection from YTD peaks in the boundaries of 99.00 the figure recorded last Thursday.
  • The 97.11/96.97 band, where converge the multi-month resistance line and the critical 200-day SMA should offer strong contention and is expected to hold the downside for the time being.
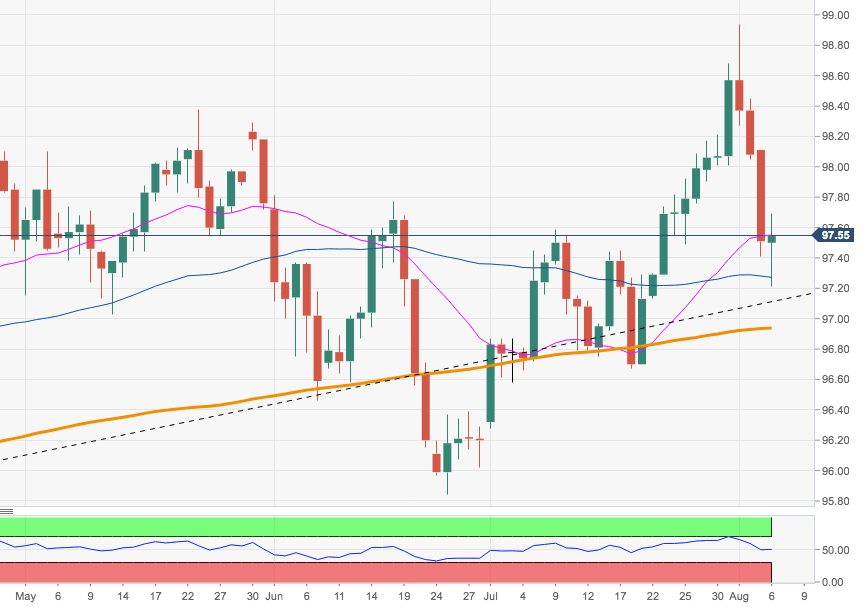
  • Above this area, the constructive outlook on the buck is seen unchanged. Next on the upside now appears a Fibo retracement at 97.87 and the 10-day SMA at 97.95.

DXY daily chart


FX Street

FX Street

FXStreet is the leading independent portal dedicated to the Foreign Exchange (Forex) market. It was launched in 2000 and the portal has always been proud of their unyielding commitment to provide objective and unbiased information, to enable their users to take better and more confident decisions.