- Key resistance confluence limits the USD/CAD pair’s upside from seven-week high amid overbought RSI.
- 50-DMA acts as near-term strong support.
USD/CAD fails to extend the previous run-up as it steps back from 100/200 DMA while taking rounds to 1.3277 during early Wednesday.
With the overbought conditions of 14-day relative strength index (RSI) also favoring the pair’s latest pullback, prices may revisit 38.2% Fibonacci retracement level of December 2018 to July downpour, at 1.3264; though, 50-day moving average (DMA) level of 1.3205 can question further declines.
If prices keep trading southwards past-1.3205, also breaking down the 1.3200 round-figure, early July tops surrounding 1.3150 could be on the bears’ radar.
Alternatively, 1.3303/08 resistance-confluence becomes the key for buyers to watch as a break of which can further escalate the pair’s rise towards 50% and 61.8% Fibonacci retracement levels of 1.3340 and 1.3417 respectively.
USD/CAD daily chart
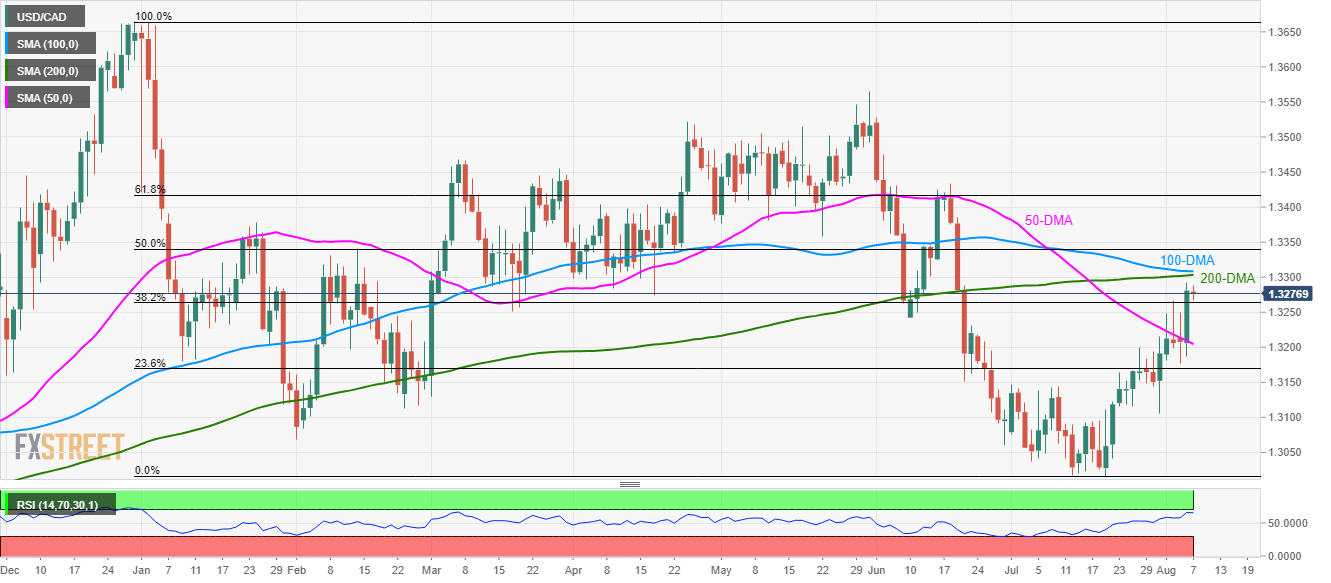
Trend: Pullback expected
