- Overbought RSI, 61.8% Fibonacci retracement limit AUD/NZD upside towards 10-week old resistance-line.
- China’s July month trade data beat expectations, supporting Aussie upside.
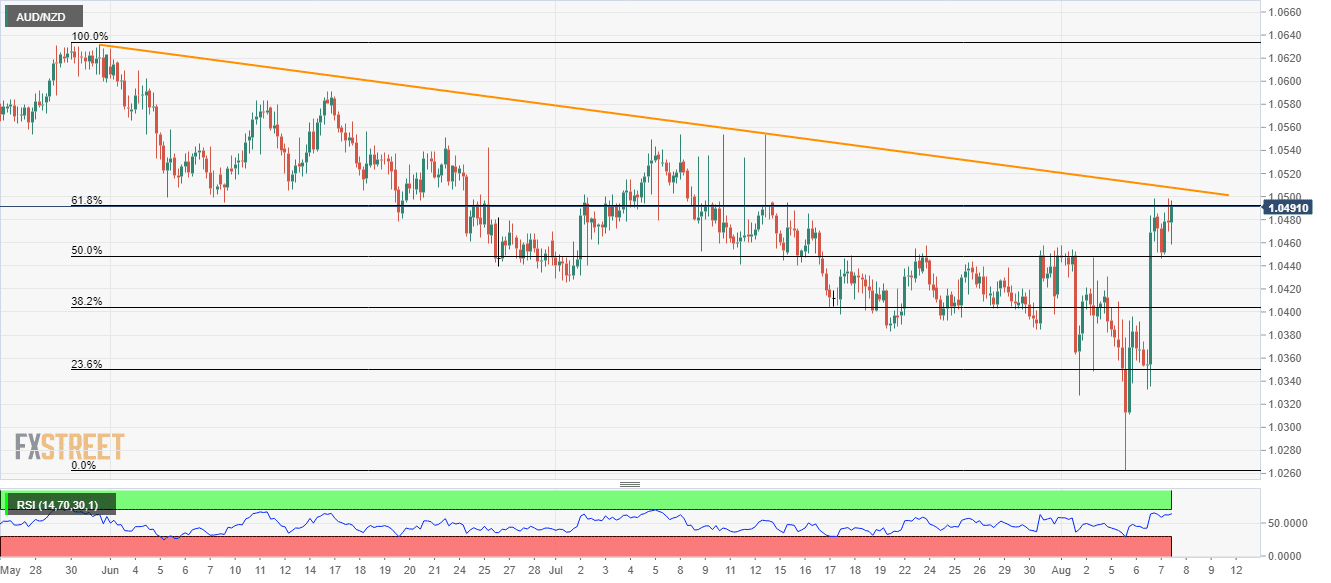
- 50% Fibonacci retracement level can act as immediate support.
With China’s July month trade data beating overall market consensus, AUD/NZD again aims for near-term resistance-line while taking the bids to 1.0490 during early Thursday.
Read: China’s July trade data (CNY): Surplus beats estimates, Exports show a solid surge, Aussie keeps highs
However, 61.8% Fibonacci retracement level of its declines since May-end, at 1.0492, limits the quote’s run-up to a downward sloping trend-line from May-end at 1.0510.
Also adding strength to the resistance is overbought conditions of 14-bar relative strength index (RSI).
As a result, sellers may take a risk to target 50% Fibonacci retracement level of 1.0448 while putting a stop-loss of 1.0510. Following the target, bears aiming July 22 low of 1.0383 can enter.
Alternatively, pair’s rise past-1.0510 enables it to confront early-July top surrounding 1.0555 whereas June month top close to 1.0595 and May-end high of 1.0634 can lure buyers afterward.
AUD/NZD 4-hour chart
Trend: Pullback expected
