- USD/JPY remains below 100-HMA, near-term resistance-line despite repeatedly bouncing off 105.50.
- Bears eye for January month low while buyers look for 107.57/58 during breakouts.
USD/JPY fails to justify its latest recovery as it trades near 106.21, a level below 100-hour moving average (HMA) and a falling trend-line since August 01, ahead of Thursday’s European open.
The 14-bar relative strength index (RSI) is also showing normal condition and hence indicates brighter chances of a pullback towards recent low near 105.50.
In a case prices slip beneath 105.50, January month bottom surrounding 104.75 could appear on bears’ radar.
Meanwhile, a successful break beyond 100-HMA level of 106.31, and also crossing immediate resistance-line around 106.66, can propel prices to 107.57/58.
If the quote remains strong above 107.58, 108.00, 108.50 and month’s high around 109.32 could lure buyers.
USD/JPY hourly chart
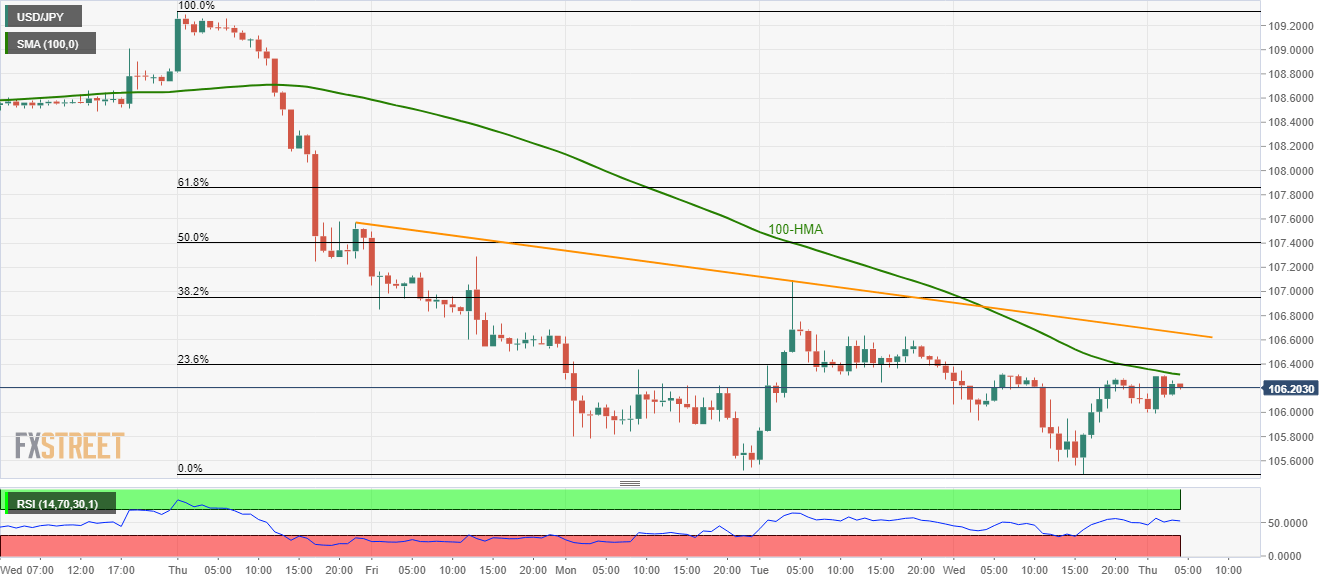
Trend: Pullback expected
