- 50-hour EMA and seven-day long descending trend-line limit WTI’s immediate upside.
- 23.6% Fibonacci retracement, $52.20 seem close supports.
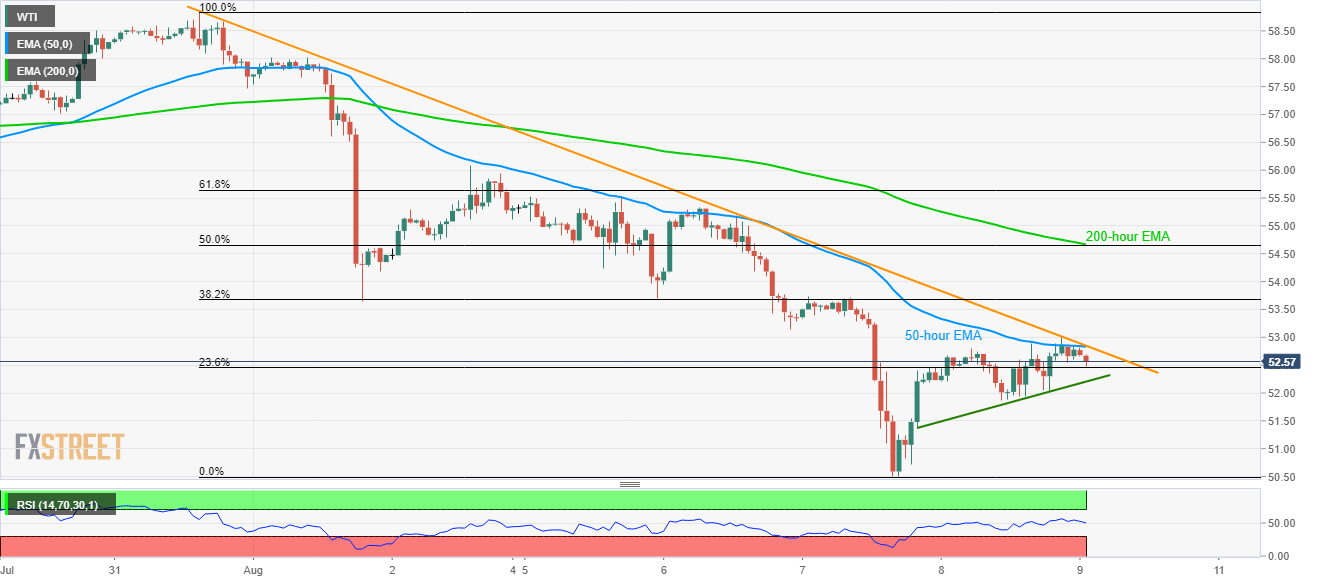
Despite being above 23.6% Fibonacci retracement of its one-week downpour from July 31, WTI remains below seven-day long resistance-line as it trades near $52.62 during early Friday.
Not only near-term resistance-line but 50-hour exponential moving average (EMA) also portrays $52.83/85 as the key upside barrier for the energy benchmark, a break of which can trigger its run-up towards 38.2% Fibonacci retracement level of $53.67.
However, a confluence of 200-hour EMA and 50% Fibonacci retracement, near $54.66/67 could confine the quote’s further advances.
Meanwhile, a downside break of 23.6% Fibonacci retracement level of $52.46 can avail immediate rising support-line at $52.20 as a rest-point.
Should there be increased selling pressure below $52.20, $51.25, $50.50 and $50.00 are likely following numbers to appear on the bears’ radar.
WTI hourly chart
Trend: Sideways
