- USD/JPY’s 4-hour chart shows a bullish divergence of RSI.
- The pair created a hammer candle on Wednesday, eyes corrective bounce.
USD/JPY is currently trading largely unchanged on the day at 16.02, having hit a low of 105.72 earlier today.
The currency pair could rise to 106.30-106.50 during the day ahead as the 4-hour chart is reporting a bullish divergence of the relative strength index (RSI).
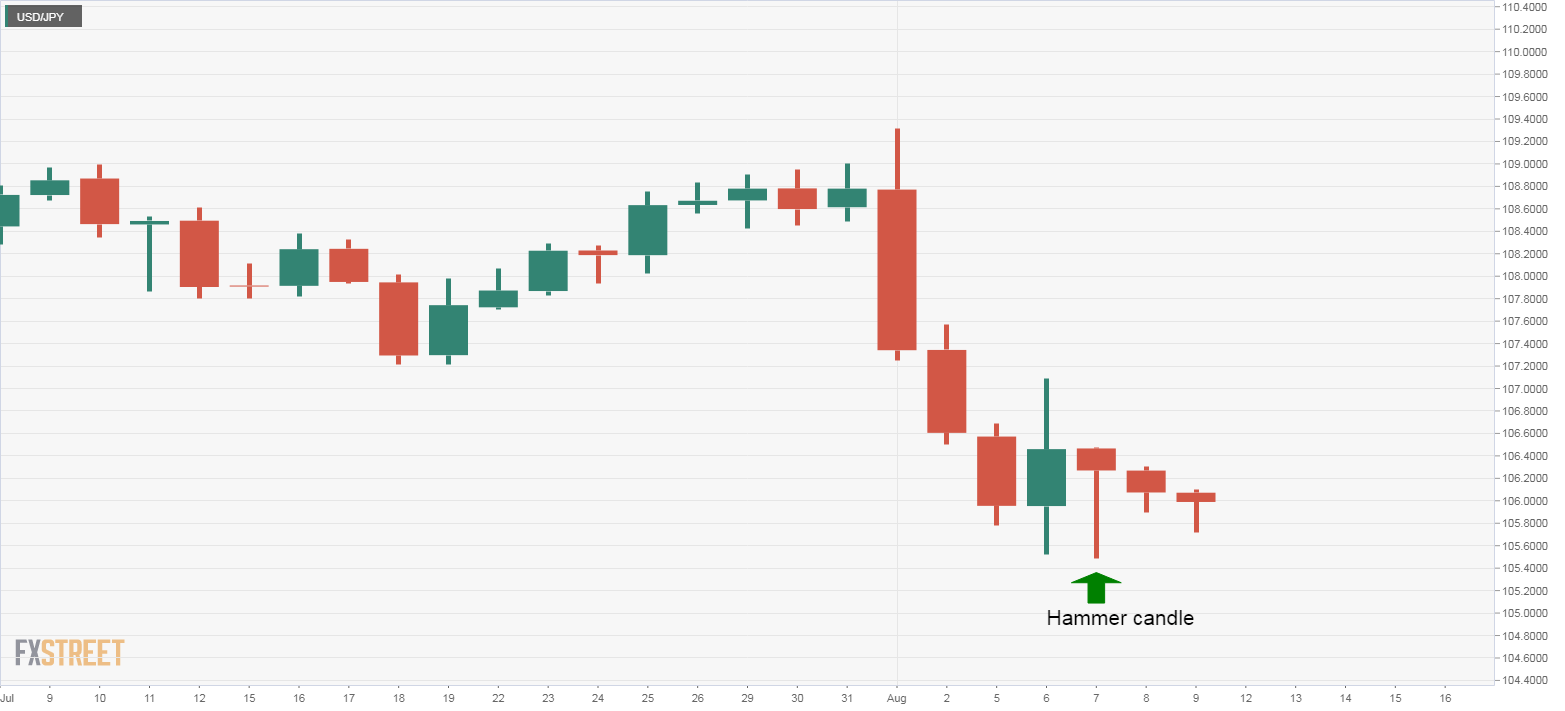
On the daily chart, there are signs of seller exhaustion. For instance, two out of the last three candles have long tails. Also, the pair created a hammer candle on Wednesday, an early warning of a potential bullish reversal.
4-hour chart
-637009175364664410.png)
Daily chart
Trend: Bullish
Pivot points
