- The USD/CAD pair’s pullback from 200-day SMA takes rest around short-term key supports.
- 23.6% Fibonacci retracement and 1.3355 can entertain traders during either side breaks.
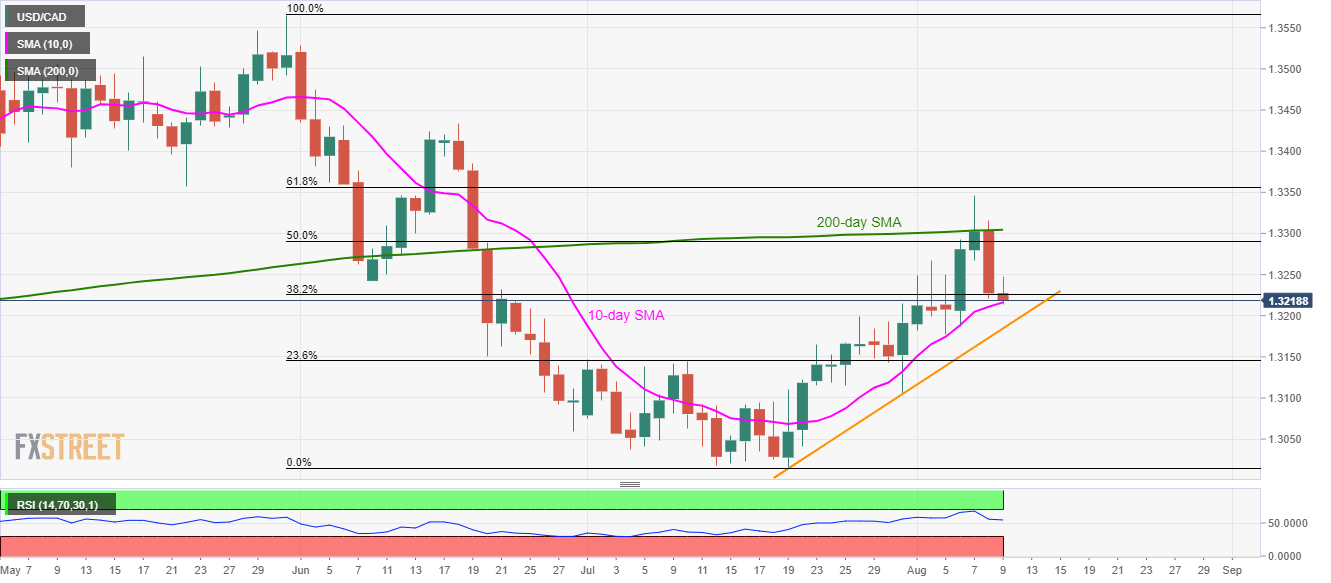
Following its failure to sustained 200-day SMA break, USD/CAD rests on 10-day SMA while trading near 1.3220 ahead of Friday’s European open.
In addition to 10-day simple moving average (SMA) level of 1.3215, an upward sloping trend-line since July 19, at 1.3185, also limits pair’s near-term declines.
Given the sellers dominate after 1.3185, 23.6% Fibonacci retracement of May-end to mid-July south-run near 1.3145 can flash on their radar.
Meanwhile, pair’s U-turn from current levels can have 50% Fibonacci retracement level of 1.3290 and 200-day SMA, at 1.3305, as immediate resistance, a break of which can push prices to 61.8% Fibonacci retracement level of 1.3355.
USD/CAD daily chart
Trend: Sideways
