- USD/IDR remains firm amid positive MACD signal.
- 50-week SMA and 38.2% Fibonacci retracement become the key upside barriers.
- 23.6% of Fibonacci retracement can entertain short-term sellers.
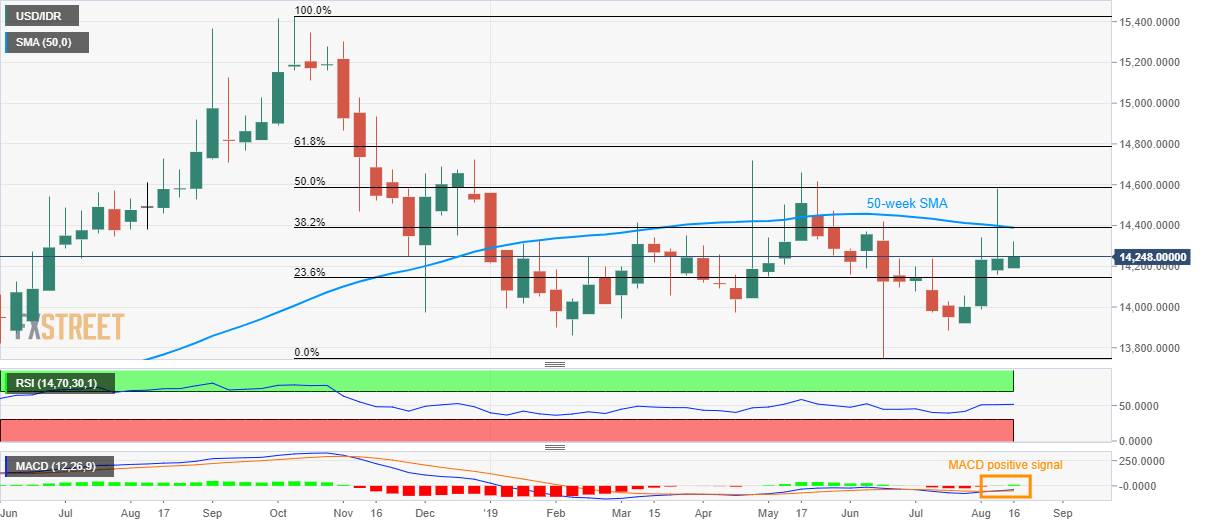
Despite repeated failures in registering a sustained break of 14,388/90 resistance-confluence, positive signal by important technical indicator portrays the USD/IDR pair’s strength as it takes the bids to 14,248 during the early Asian session on Tuesday.
The 50-week simple moving average (SMA) and 38.2% Fibonacci retracement of October 2018 to mid-2019 downpour defines the 14,388/90 area as the key resistance confluence.
With the recent price-positive signal from the moving average convergence and divergence (MACD) indicator, traders can push the quote beyond the key upside barrier in order to aim for 50% Fibonacci retracement level of 14,588 and then rising towards April month top surrounding 14,720.
Meanwhile, 23.6% Fibonacci retracement level of 14,144 and 14,000 round-figure can entertain short-term sellers during the pullback.
USD/IDR weekly chart
Trend: Bullish
