- DXY (US Dollar Index) retraces down slightly as the week is coming to an end.
- The next targets to the upside can be located at 98.10 and the 98.38 levels.
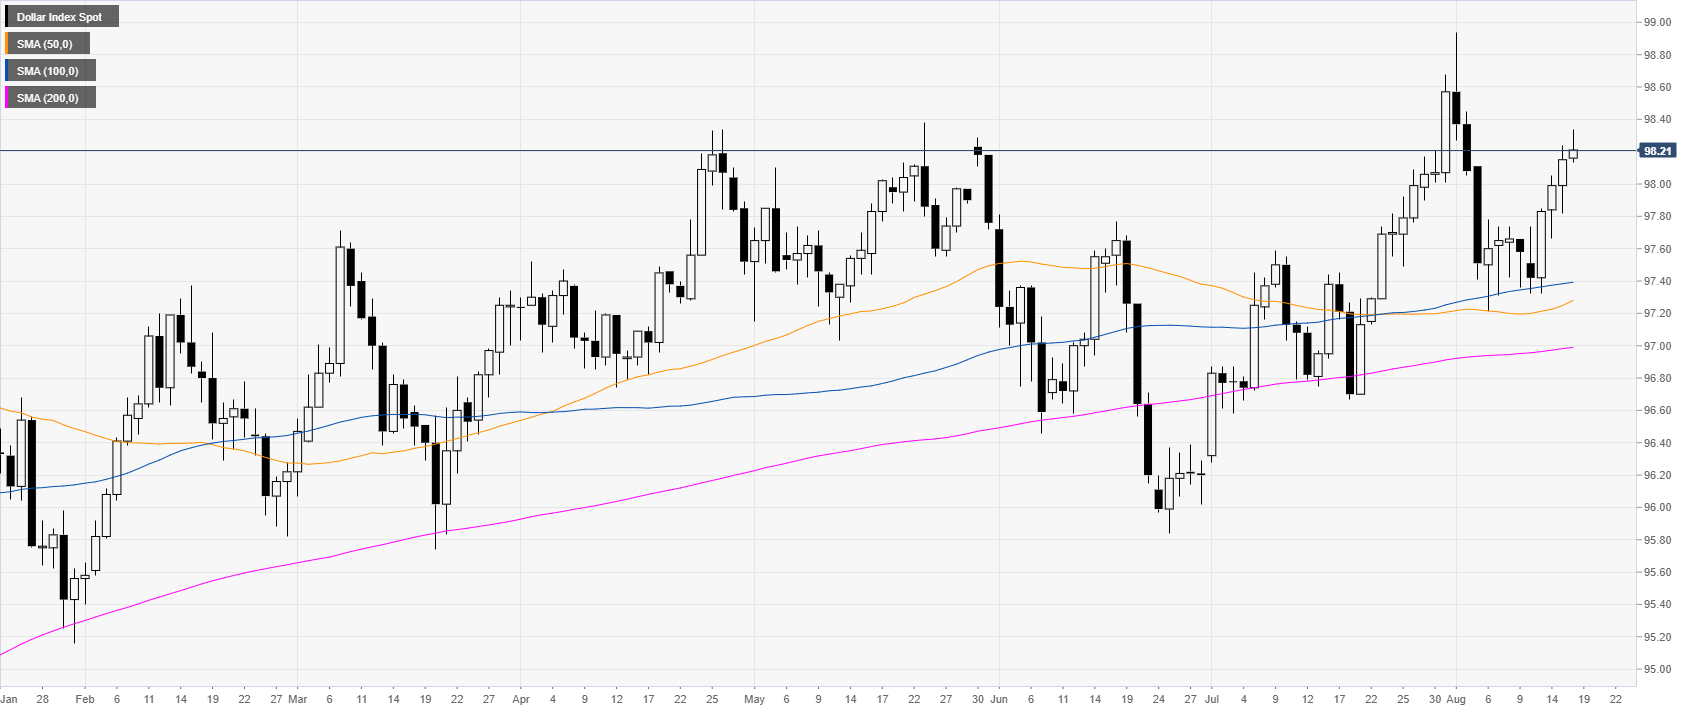
DXY daily chart
DXY (US Dollar Index) is evolving in a bull trend above its main daily simple moving averages (DSMAs). DXY got a boost on Thursday as the European Central Bank’s (ECB) member Olli Rehn said that ECB stimulus package in September might overshoot expectations. Also, the Retail Sales Control Group in July surpassed expectations adding to the positive sentiment on the Greenback.
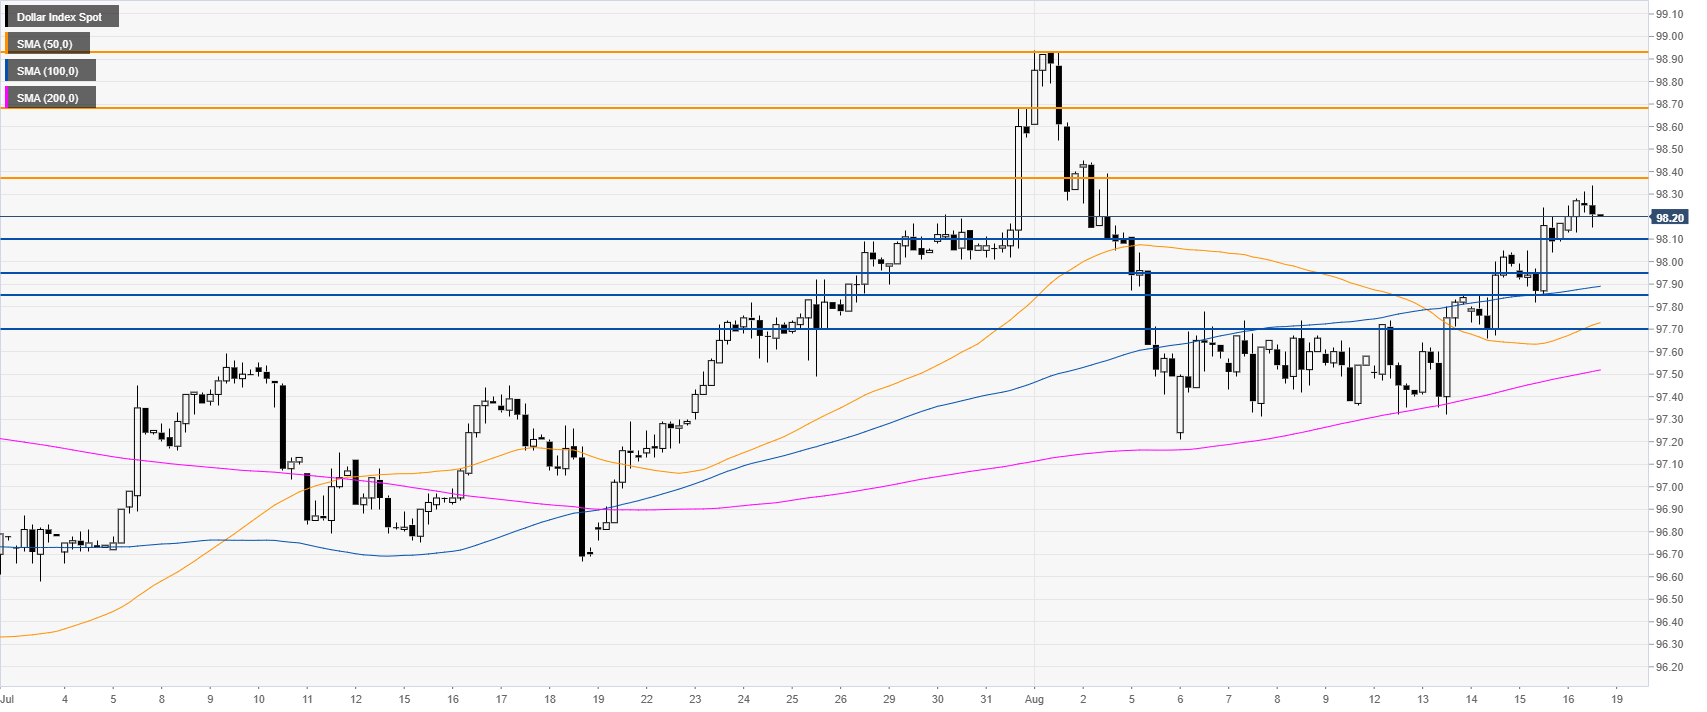
DXY 4-hour chart
The market almost reached 98.38 resistance while above its main SMAs. DXY bulls need to clear this level to climb towards 98.68 and the 98.93 levels.
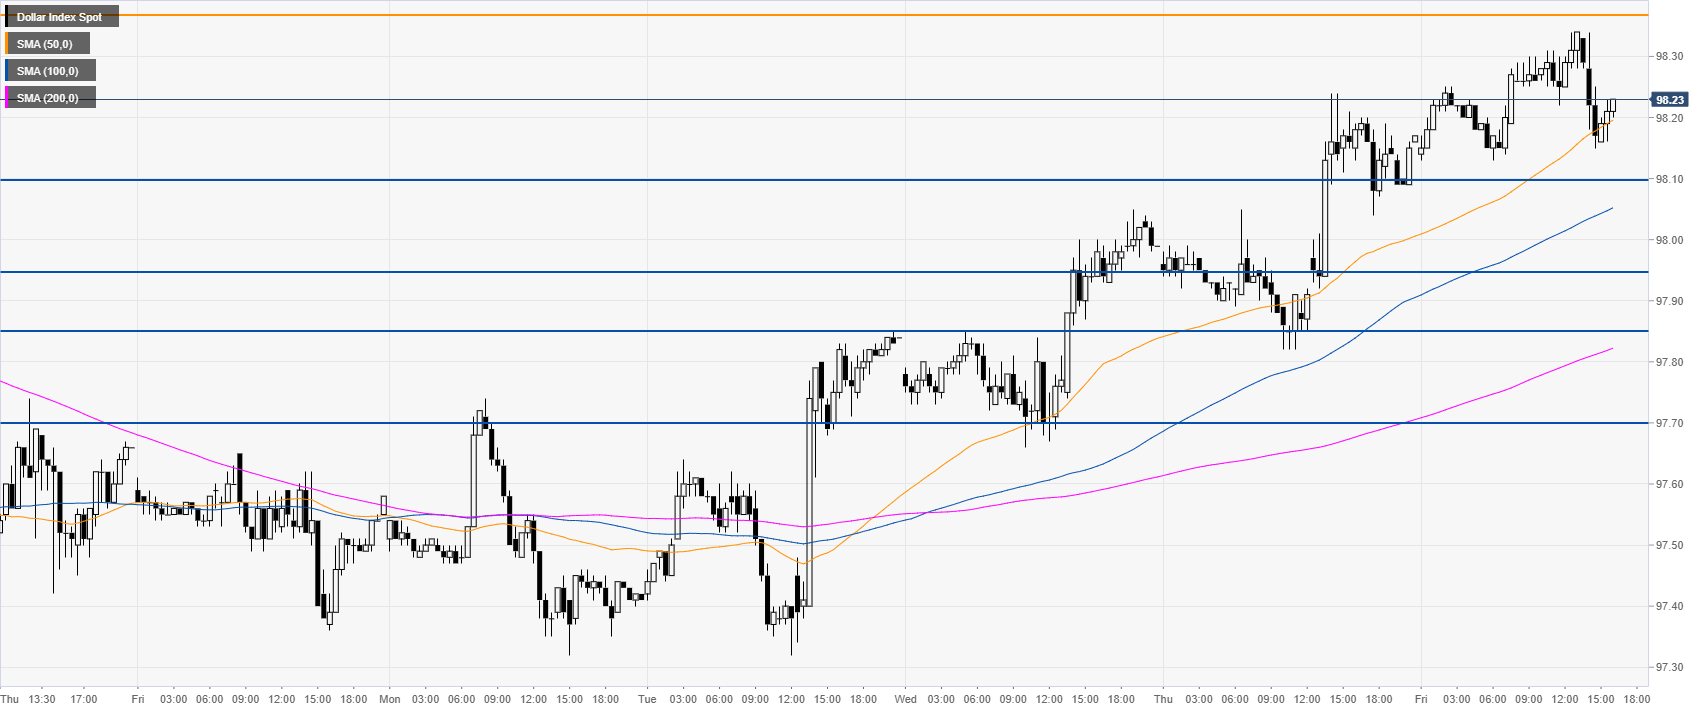
DXY 30-minute chart
The Greenback is trading above the 98.10 support and the 50 SMA. Immediate support could be found near the 98.10, 97.95 and 97.85 levels.
Additional key levels
