- DXY (US Dollar Index) accelerated to the 98.38 resistance at the end of the New York session.
- The next potential bullish targets on the way up could be located at 98.68 and 98.93 (2019 high).
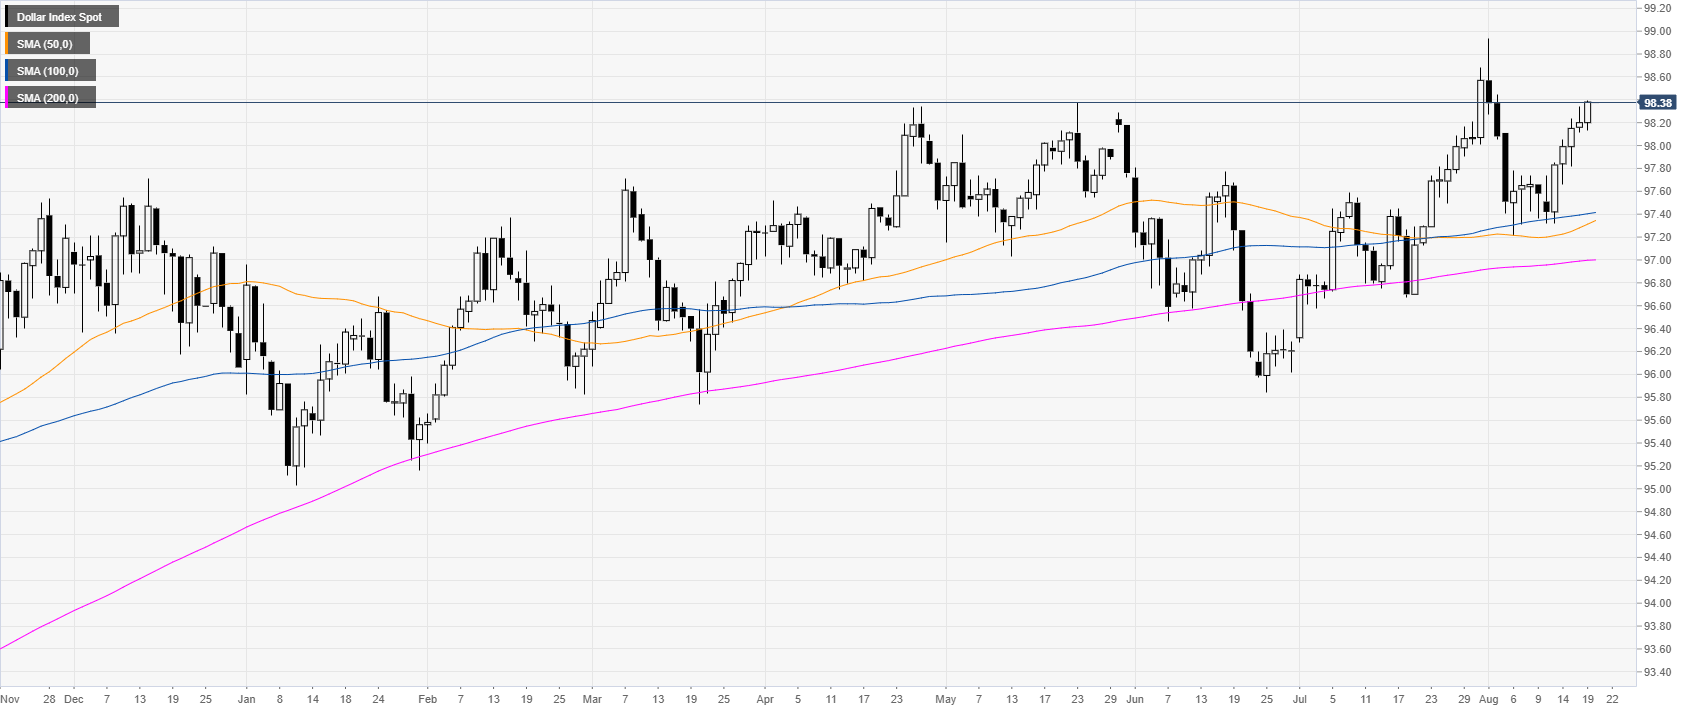
DXY daily chart
DXY (US Dollar Index) is in a bull trend above its main daily simple moving averages (DSMAs). The Greenback has accelerated to the upside in the second part of the New York session this Monday.
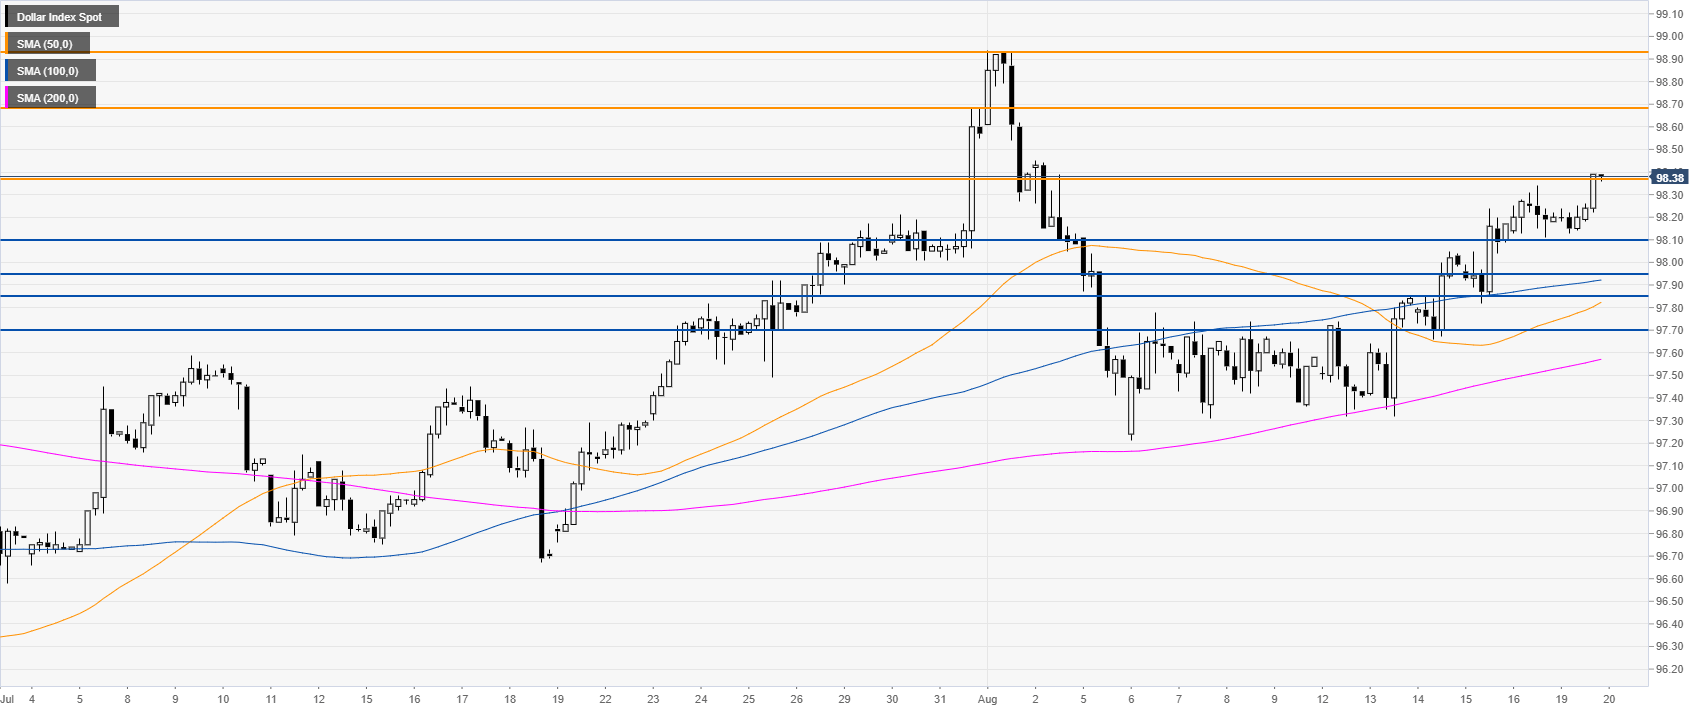
DXY 4-hour chart
DXY bulls have a daily close just at the 98.38 key resistance. This could open the gates to further appreciation towards 98.68 and potentially to 98.93 level (2019 high).
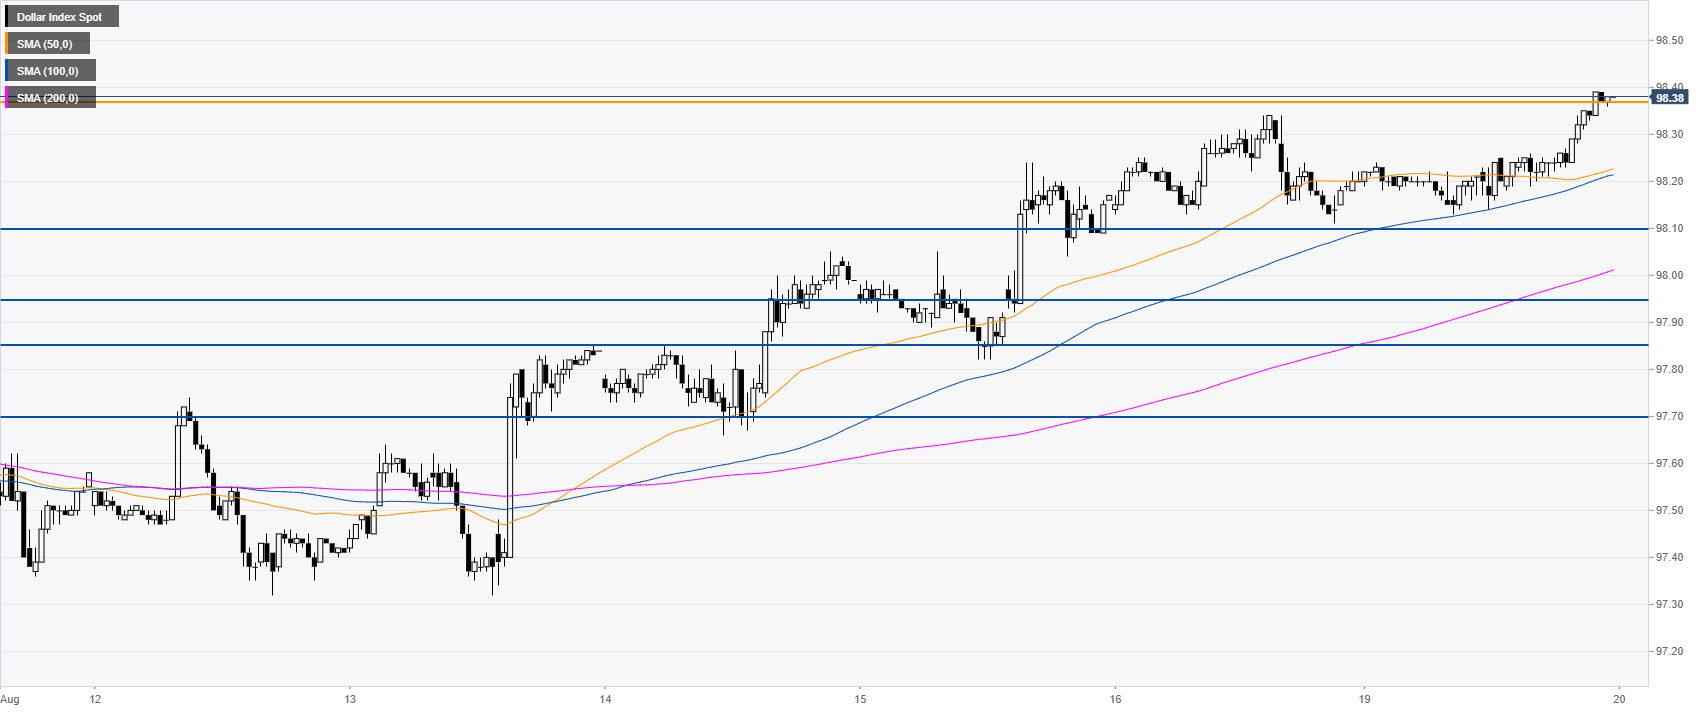
DXY 30-minute chart
The Greenback is trading above its main SMAs, suggesting bullish momentum in the short term. Immediate support could be found near the 98.10, 97.95 and 97.85 levels.
Additional key levels
