- USD/INR consolidates from eight-month high amid overbought technical indicators.
- 10-DMA becomes sellers’ favorite while 61.8% Fibonacci retracement gains buyers’ attention.
USD/INR retraces from fresh 2019 high as it takes the rounds to 71.6350 ahead of Tuesday’s European session.
With the overbought conditions of 14-day relative strength index (RSI) luring sellers, 10-day simple moving average (DMA) level of 71.2057 may become their immediate favorite whereas 38.2% Fibonacci retracement of 2018 swing high to 2019 swing low, at 70.80, will satiate them afterward.
It should, however, be noted that pair’s extended south-run below 70.80, can take aim at 200-DMA level of 70.000.
On the upside, 72.40 comprising 61.8% Fibonacci retracement level should be on the bulls’ radar during further advances while December 2018 high around 72.82 will be next to watch.
USD/INR daily chart
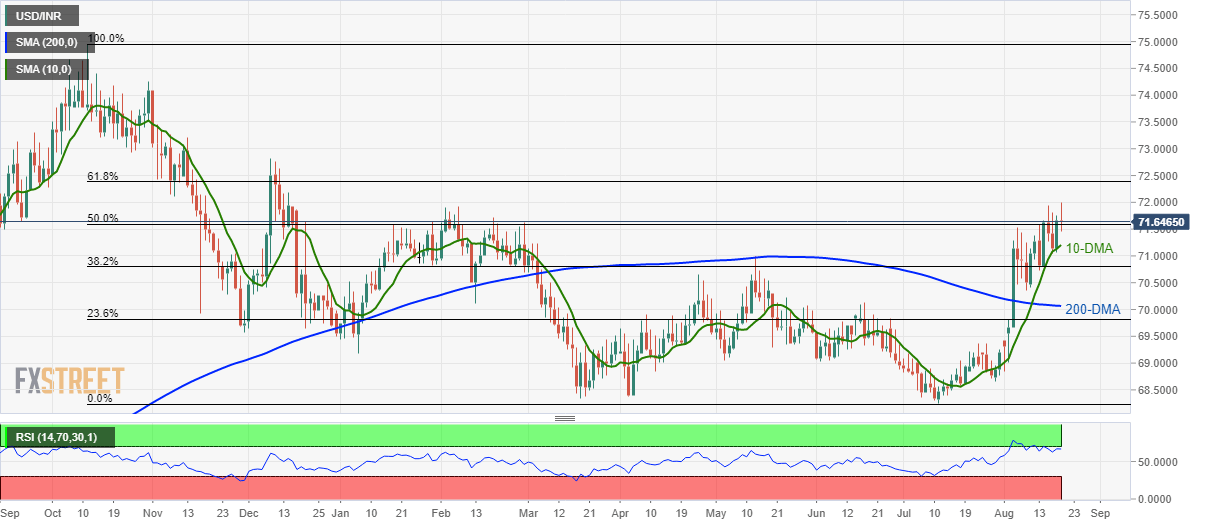
Trend: Pullback expected
