- Gold is ending the week below the 1,530.00 level.
- The level to beat for sellers is $1,510.00/oz and 1,490.00 support.
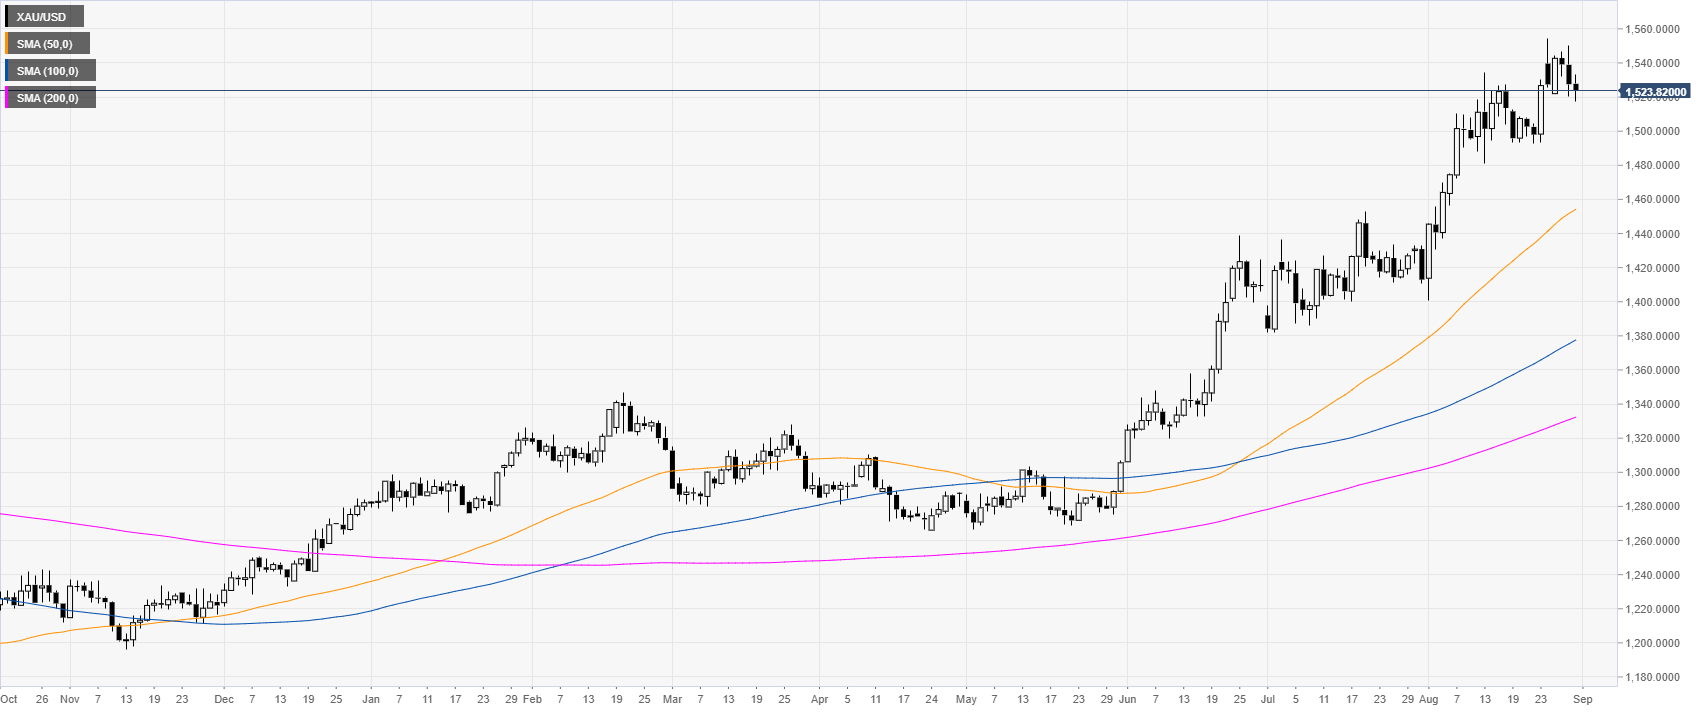
Gold daily chart
Gold is trading in a bull trend above its main daily simple moving averages. The yellow metal is off multi-year highs after peaking at 1,554.63 on Monday, ending the week on a weak tone.
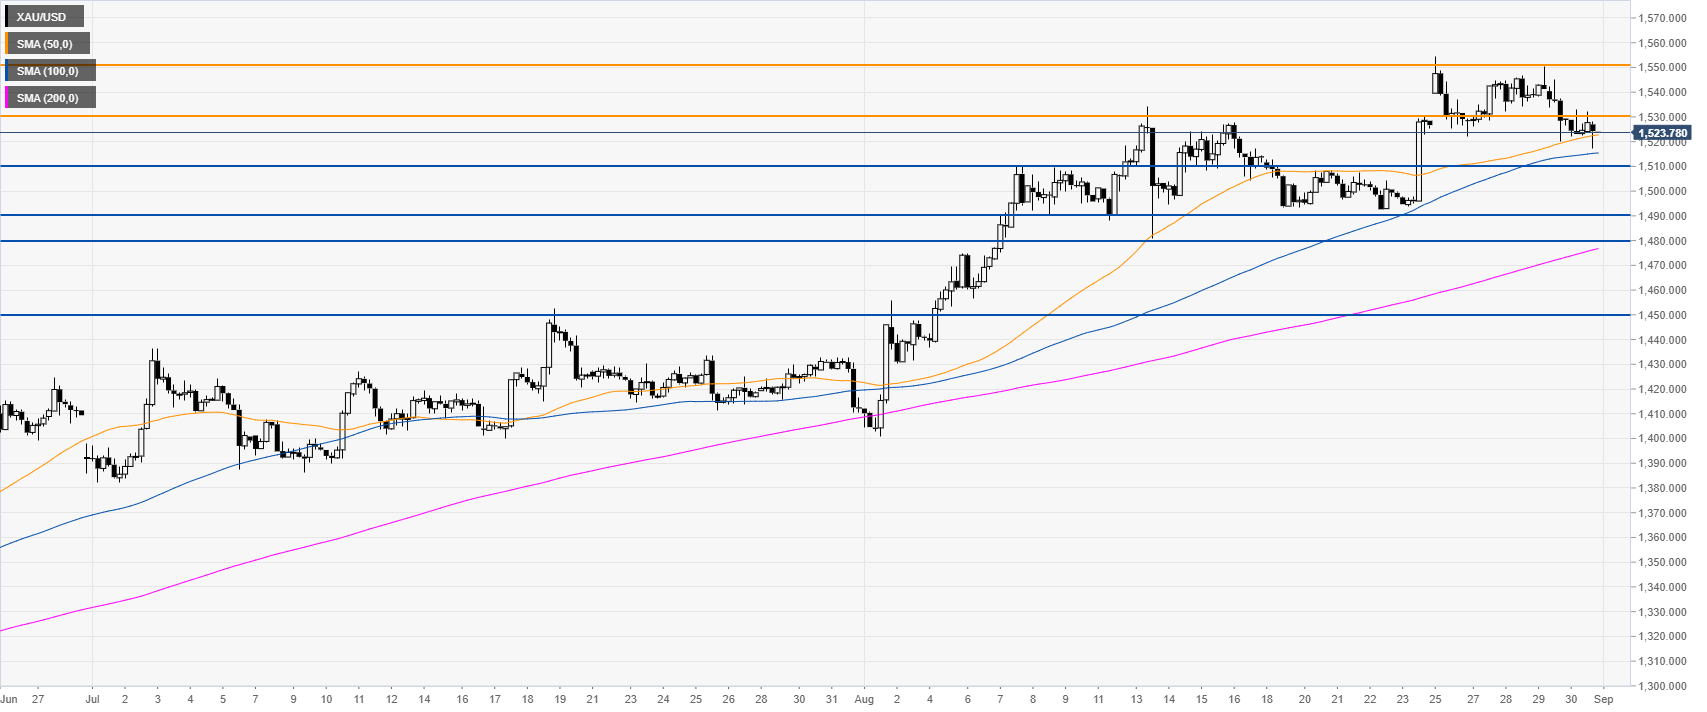
Gold 4-hour chart
Gold is trading above 1,510.00 support and its main SMAs, suggesting bullish momentum in the medium term. However, bulls need to reclaim the 1,530.00 and 1,550.00 levels on the way up.
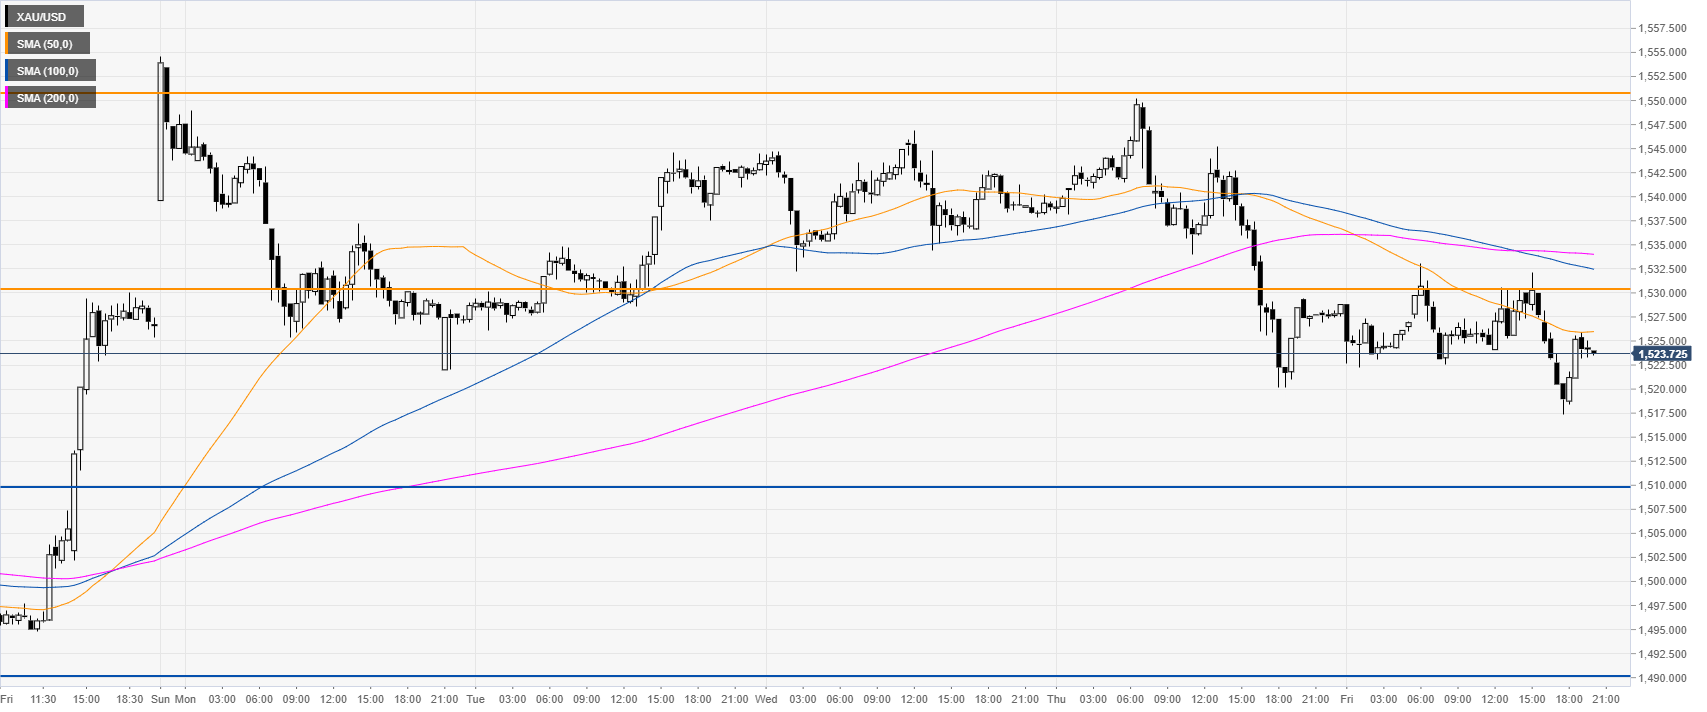
Gold 30-minute chart
Gold has found no acceptance above 1,530.00 and the main SMAs. If the sellers keep the pressure on, the market could reach 1,510.00 and 1,490.00 to the downside.
Additional key levels
