- The Cable hits fresh multi-year lows this Tuesday.
- The levels to beat for sellers are seen at 1.2016, followed by 1.1957 support levels.
- Buyers would need to have a daily close above 1.2132 to have a credible recovery.
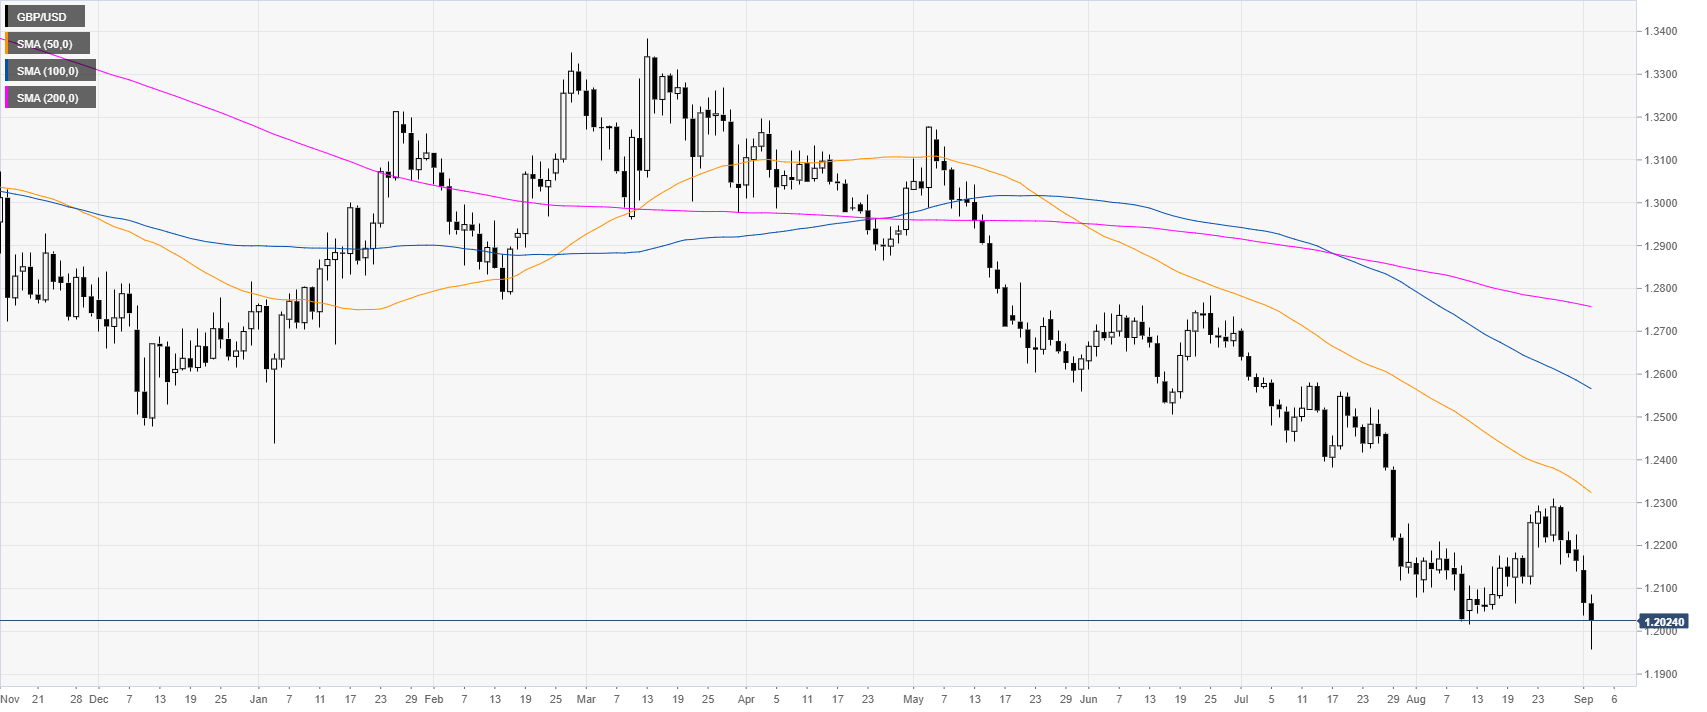
GBP/USD daily chart
The Sterling is trading in a bear trend below its main daily simple moving averages (SMAs) as it hit fresh multi-year lows. Brexit chaos is weighing heavily on the Pound.
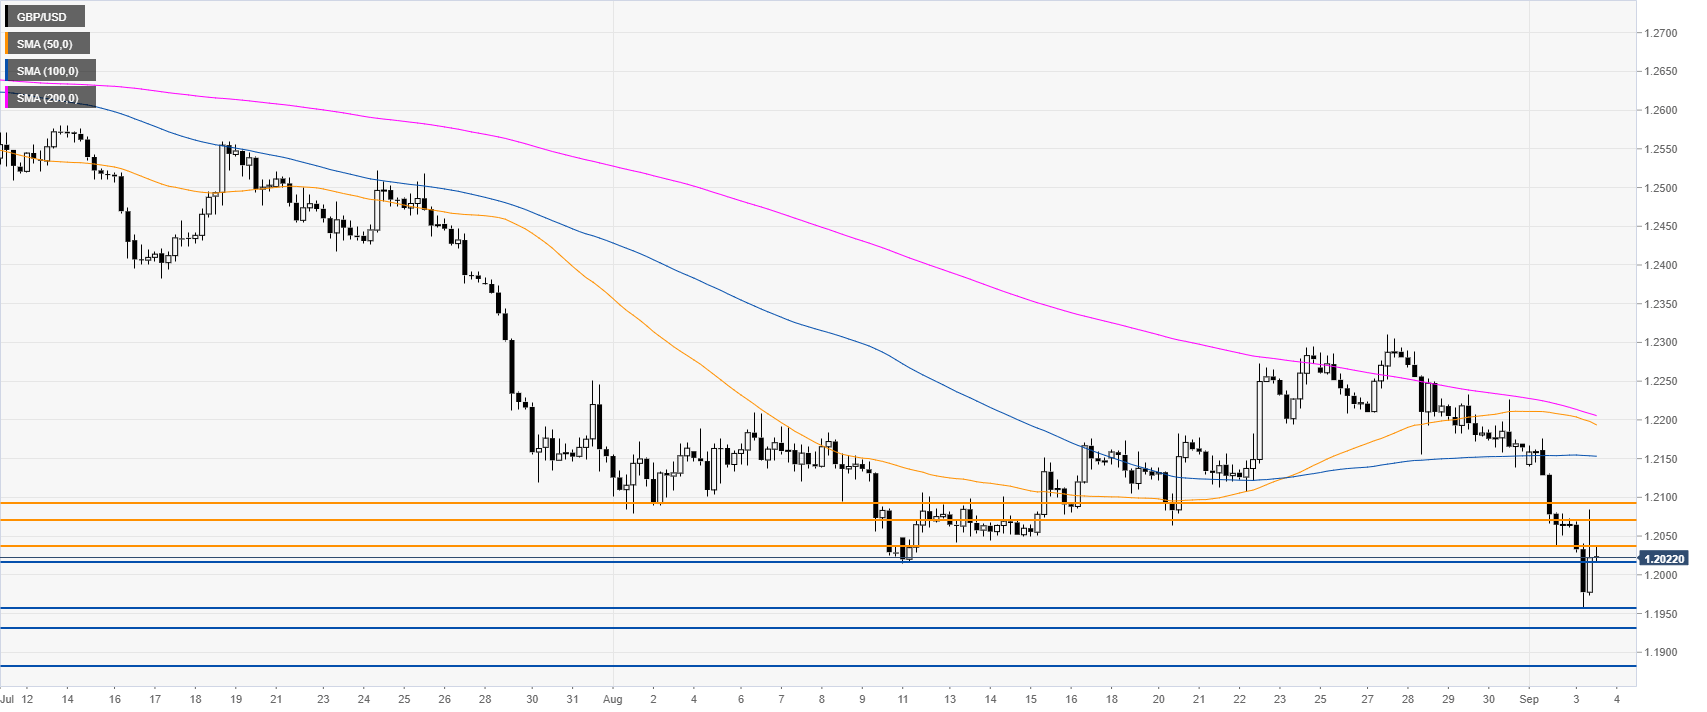
GBP/USD 4-hour chart
The Cable is under bearish pressure below 1.2038 resistance and its main SMAs on the 4-hour chart. The level to beat for sellers is 1.2016, followed by 1.1957, 1.1932 and 1.1880 level on the way down, according to the Technical Confluences Indicator.
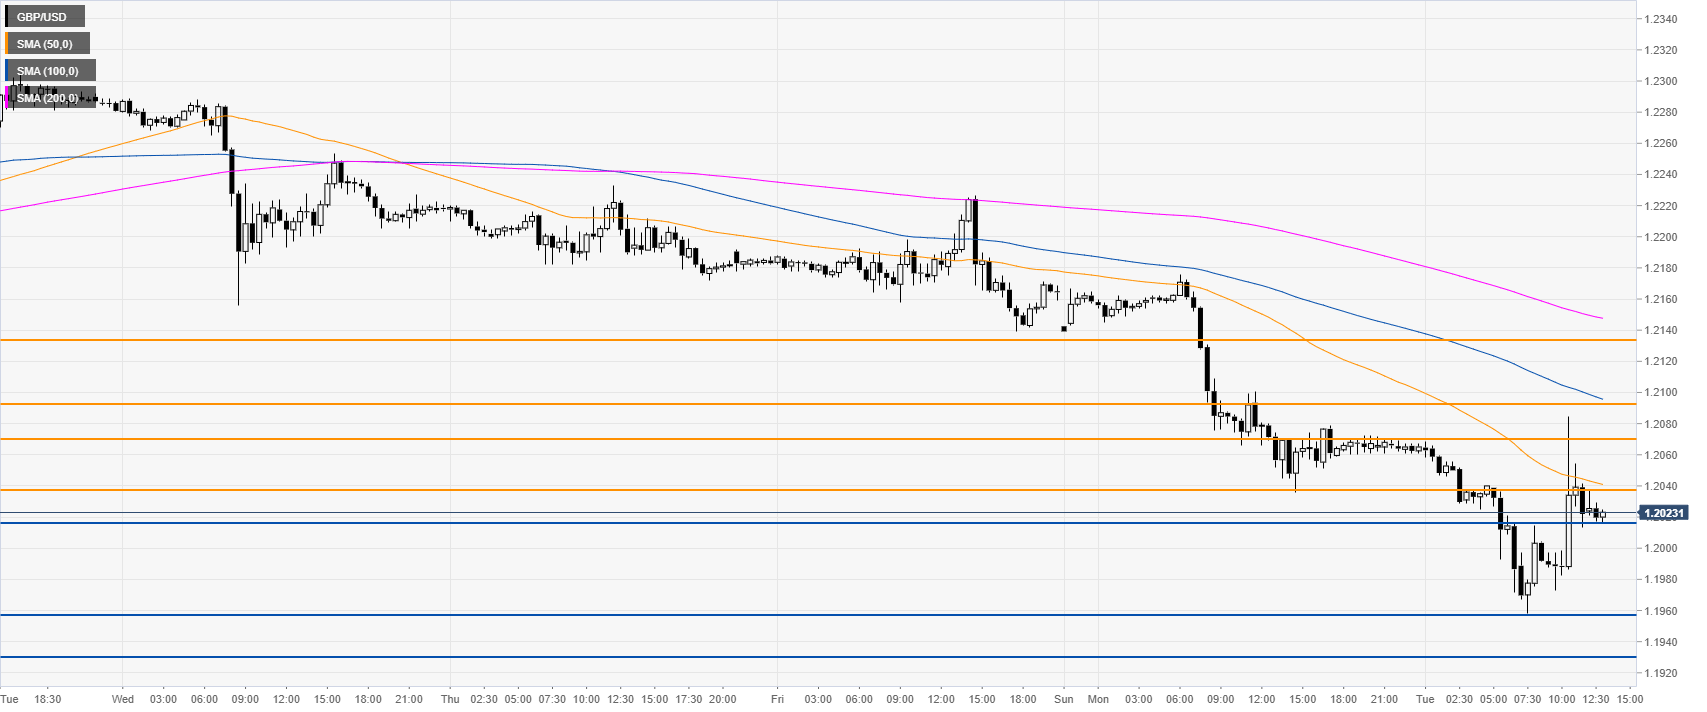
GBP/USD 30-minute chart
GBP/USD is trading below the main SMAs, suggesting a bearish bias in the near term. The market had a spike up above 1.2080 but the move up is fading. Immediate resistances are seen at the 1.2038, 1.2070 and 1.2095, according to the Technical Confluences Indicator. Bulls would need to have a daily close above 1.2132 to have a credible recovery.
Additional key levels
